TMUS remains in an all-time bullish sequence. The recent dip appears to have found support in the blue box. The resultant bounce could advance to $300 thus, keeping the buyers in control.
T-Mobile US (NASDAQ: TMUS) is a leading U.S. wireless carrier, known for its aggressive pricing and nationwide 5G network. Headquartered in Bellevue, Washington, it is majority-owned by Deutsche Telekom. Since merging with Sprint in 2020, T-Mobile has become the third-largest U.S. telecom provider. It is listed on the NASDAQ-100 and S&P 500 indices.
TMUS has been the best stock investment since its launch in the secondary market in April 2007. Its stock price initially dropped from around $34 to a low of $7.75 in January 2010. However, the stock has risen significantly since that low, establishing a clear, all-time bullish sequence. This all-time bullish cycle appears incomplete. Wave I and II ended in May 2011 and June 2012 at roughly $25 and $7.60, respectively. From the June 2012 low, wave III emerged, concluding in July 2021 at $150. A pullback for wave IV followed, ending in January 2022 at $101, providing buyers with an opportunity to purchase during the dip.
From the low of January 2022, wave V started and has been very strong. Waves ((1)), ((2)), and ((3)) of V ended in November 2022 at $154, June 2023 at $125, and March 2025 at $276.5 respectively. The stock peaked at the March 2025 high of $275.5, where wave ((3)) ended. From that peak, wave ((4)) of V pullback emerged. In such a clean and clear bullish sequence, we like to stay buyers from the blue box.
TMUS Elliott Wave Analysis - 17th November, 2025
[caption id="attachment_971426" align="aligncenter" width="1024"]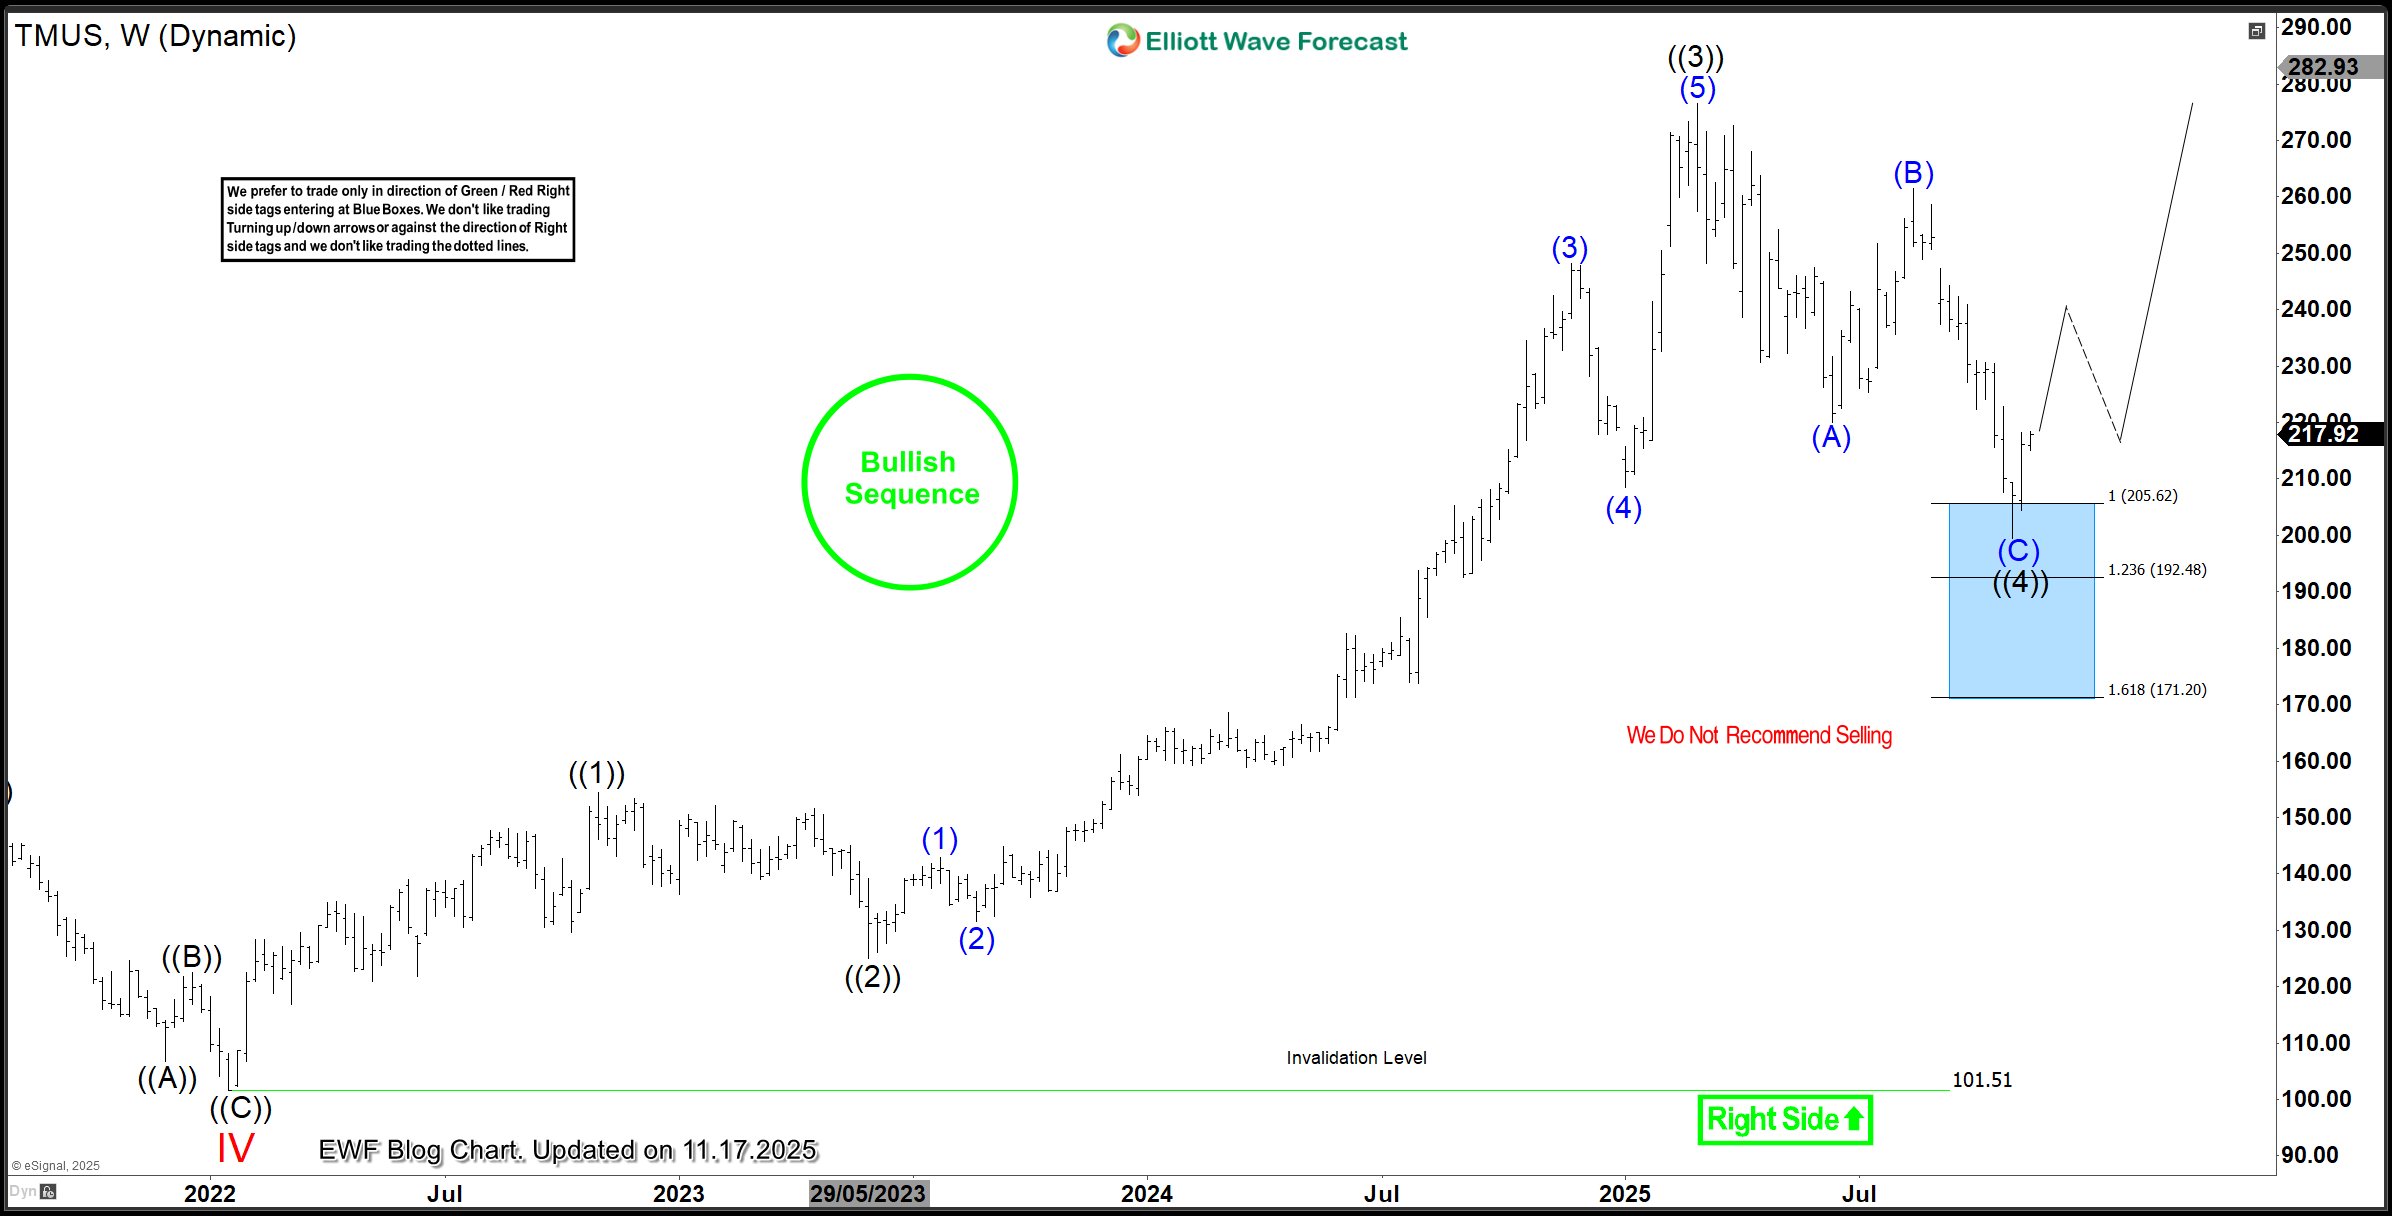 TMUS, Weekly[/caption]
Wave ((4)) pullback evolved as a simple zigzag structure with the extreme zone at 205.62-171.20. Meanwhile, from the blue box, buyers were expected to react and push prices higher by a 3-swing before lower, or a complete recovery for wave ((5)) of III toward $300 or higher. This is a typical example of how we analyze and trade the market with Elliottwave-forecast members. If this bounce progresses, buyers from the blue box should take partial profit at $230 and adjust the other half of the position to the wave ((4)) low or the entry price at $205.6. Buyers can hold the remaining position with a target at $300.
Disclaimer: The views expressed are solely those of the author and do not represent the official position of Followme. Followme does not take responsibility for the accuracy, completeness, or reliability of the information provided and is not liable for any actions taken based on the content, unless explicitly stated in writing.

Leave Your Message Now