In this technical blog, we will look at the past performance of the 1-hour Elliott Wave Charts of NVDA. In which, the rally from 07 April 2025 low is unfolding as an impulse structure. Showing a higher high sequence favored more upside extension to take place. Therefore, we advised members not to sell the stock & buy the dips in 3, 7, or 11 swings at the blue box areas. We will explain the structure & forecast below:
NVDA 1-Hour Elliott Wave Chart From 11.07.2025
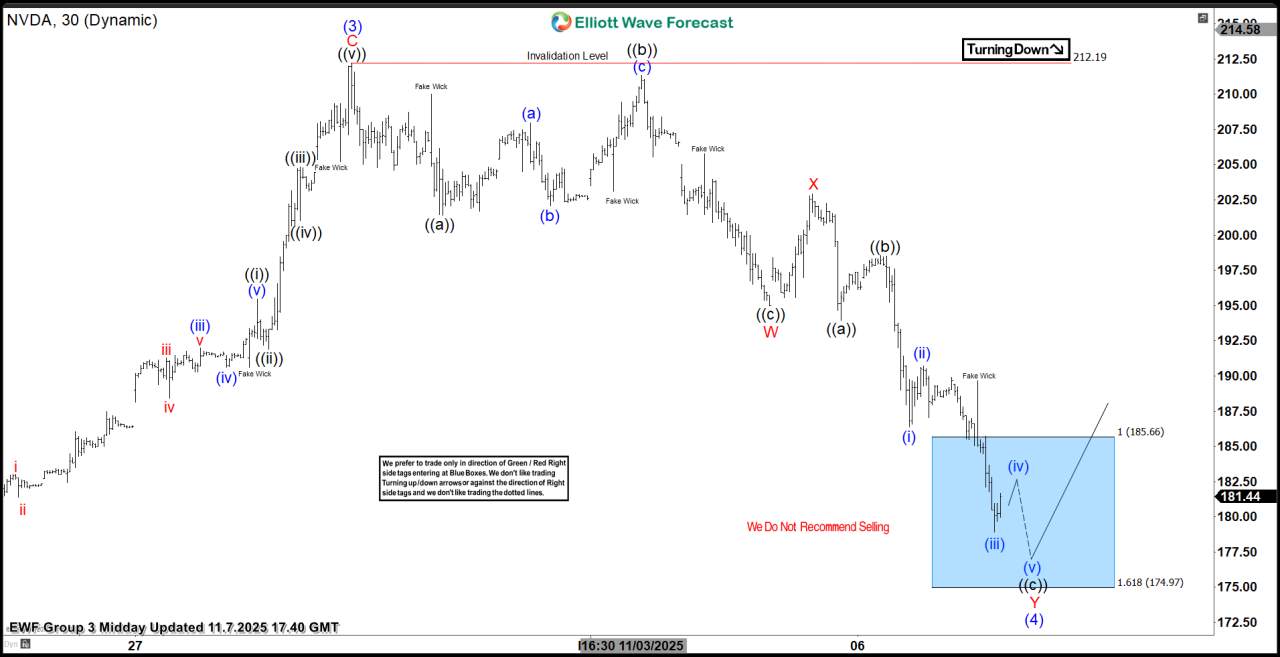
Here’s the 1-hour Elliott wave chart from the 11.07.2025 Midday update. In which, the cycle from the 21 April 2025 low ended in wave (3) at $212.19 high. Down from there, the stock made a pullback in wave (4) to correct that cycle. The internals of that pullback unfolded as Elliott wave double three structure where wave W ended at $195 low. Wave X bounce ended at $202.92 high & wave Y managed to reach the blue box area at $185.66- $174.97. From there, buyers were expected to appear looking for the next leg higher or for a 3 wave bounce minimum.
NVDA Latest 1-Hour Elliott Wave Chart From
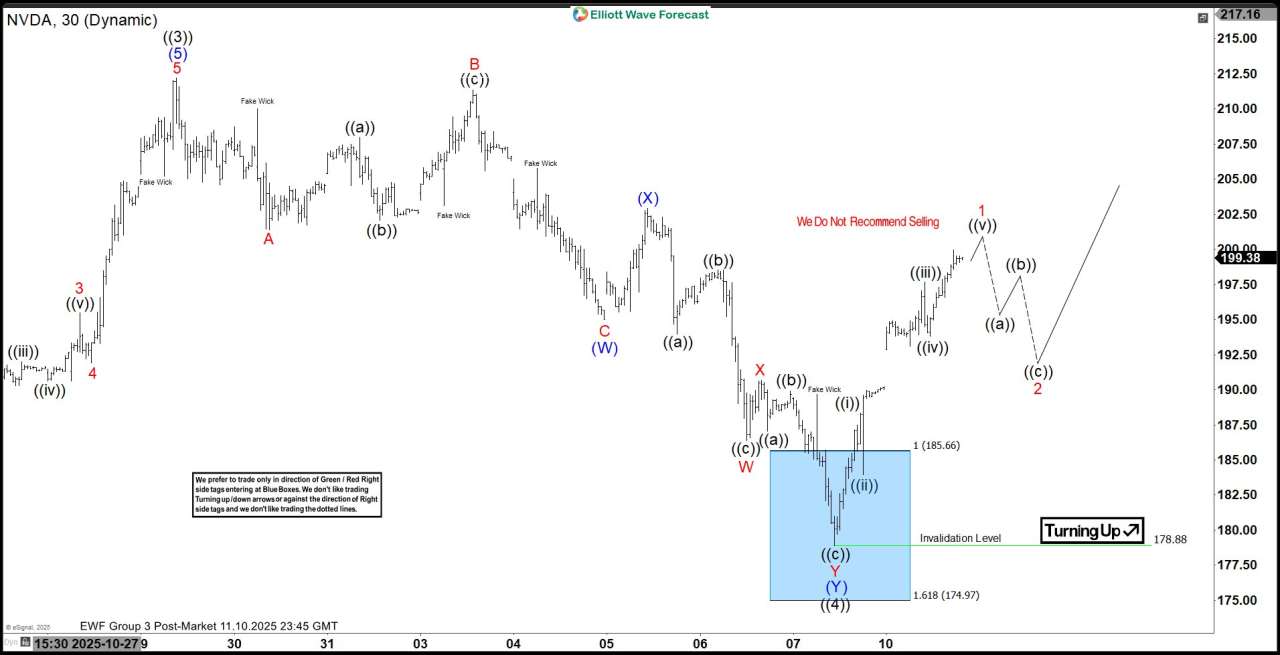
This is the latest 1-hour Elliott wave Chart from the 11.10.2025 Post-Market update. In which the NVDA is showing a reaction higher taking place, right after ending the double correction within the blue box area. Allowed members to create a risk-free position shortly after taking the long position at the blue box area. However, a break above $212.19 high is still needed to confirm the next extension higher towards $220.01- $232.72 area minimum & avoid a double correction lower.
Disclaimer: The views expressed are solely those of the author and do not represent the official position of Followme. Followme does not take responsibility for the accuracy, completeness, or reliability of the information provided and is not liable for any actions taken based on the content, unless explicitly stated in writing.

Leave Your Message Now