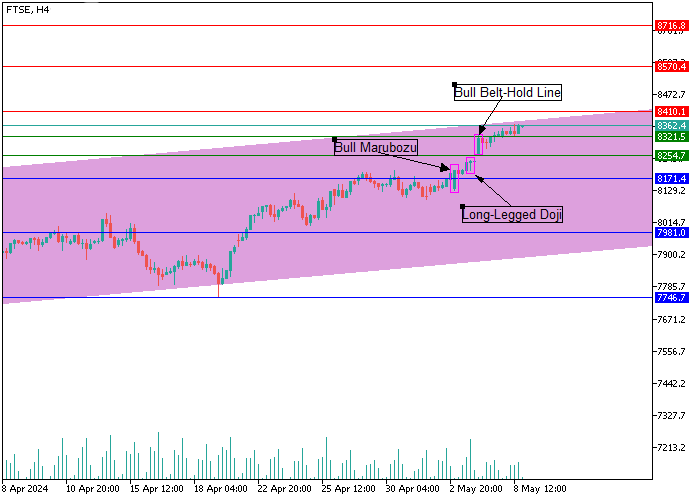
FTSE 100, H4
On the four-hour chart, the price is holding at 8356.8: at the key support level of 8171.4, buyers have formed a Bullish Marubozu continuation pattern for the uptrend, followed immediately by a Long-Legged Doji, which confirms the continued uncertainty in the market. However, at the level of 8254.7, an upward gap and the formation of a Bullish Belt Hold figure are recorded, signaling that the situation remains under complete control of the "bulls". Intensifying growth towards the 8410.1 high is the most likely scenario at the moment. Overcoming it will act as a catalyst for movement to the area of 8570.4-8716.8, but if the "bears" manage to consolidate positions below the level of 8171.4, it is likely to reach the levels of 7981.0-7746.7.
FTSE 100, D1
On the daily chart, in the area of 8171.4-8321.5, a series of uptrend continuation patterns Rising Three Methods and Three Advancing White Soldiers have formed, the construction of which signals that the market is ready to continue the "bullish" rally. If buyers manage to consolidate above 8410.1, the prospect of strengthening the instrument’s position and moving to the area of 8570.4−8716.8 will increase significantly.

Support and resistance
Support levels: 8171.4, 7981.0, 7746.7.
Resistance levels: 8410.1, 8570.4, 8716.8.
Trading tips
Long positions should be opened above the level of 8410.1 with targets of 8570.4, 8716.8. Stop-loss — 8321.5. Implementation time: 9-12 days.
Short positions should be opened below the level of 8171.4 with targets of 7981.0, 7746.7. Stop-loss — 8254.7.


Hot
No comment on record. Start new comment.