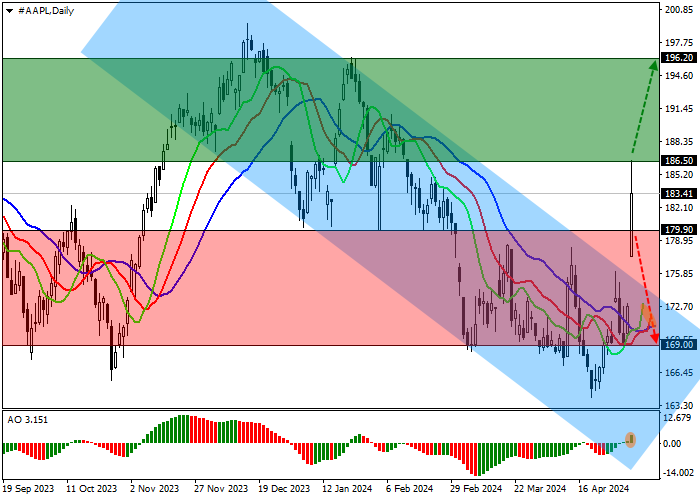
Shares of Apple Inc., a giant in the development and sale of personal and tablet computers, are trading in a corrective trend at 183.00.
On the daily chart, the price has left the downwards corridor 176.00–168.00 and is retreating from the resistance line.
On the four-hour chart, it is clear that the current movement may continue since the quotes have overcome two local highs around 178.00, and now the nearest obstacle is 196.00.
Technical indicators are strengthening the sell signal: the AO histogram continues to form upward bars above the transition level.
Trading tips
Long positions may be opened after the price rises and consolidates above 186.50, with the target at 196.20 and stop loss 182.00. Implementation period: 7 days or more.
Short positions may be opened after the price declines and consolidates below 179.90, with the target at 169.00. Stop loss is above 184.00.
Disclaimer: The content above represents only the views of the author or guest. It does not represent any views or positions of FOLLOWME and does not mean that FOLLOWME agrees with its statement or description, nor does it constitute any investment advice. For all actions taken by visitors based on information provided by the FOLLOWME community, the community does not assume any form of liability unless otherwise expressly promised in writing.


Hot
No comment on record. Start new comment.