NZD/USD, H4
On the four-hour chart of the NZD/USD pair, a large Double Bottom graphic pattern is observed at the level of 0.5879, from where the price reversed upwards. It is also worth highlighting the formation of the Hammer pattern at this level, which confirmed the growing strength of the "bulls". Currently, the asset’s quotes are trading near the resistance level of 0.5997, having formed "bullish" candlestick patterns Morning Star and Inverted Hammer. Most likely, the price of the NZD/USD pair will continue to develop upward dynamics to the resistance level of 0.5997, overcoming which will become a catalyst for opening long positions with targets in the area of 0.6055–0.6175. An alternative scenario is likely if the "bears" manage to consolidate positions below the level of 0.5919, then one should expect an increase in negative dynamics in the area of 0.5825–0.5771.

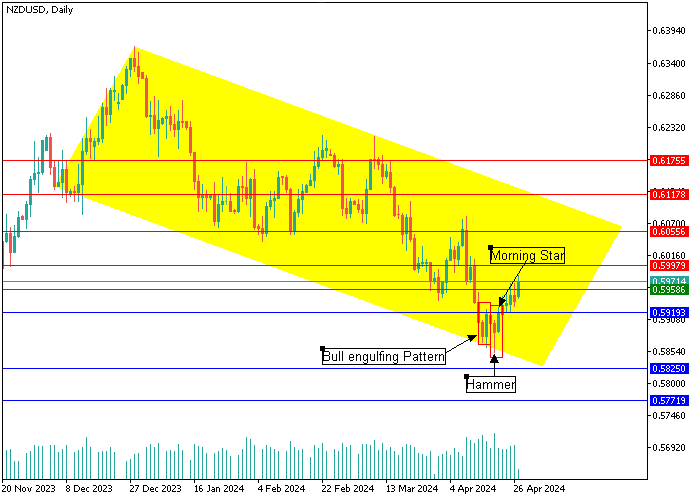
NZD/USD, D1
On the daily chart, the asset’s quotes are moving within a large downward trend; however, the construction of reversal candlestick analysis patterns Bullish Engulfing, Hammer and Morning Star at the level of 0.5879 signals that the asset is likely to reach a bottom. In addition, candlestick patterns demonstrate that price is ready for a major trend reversal due to increasing buying pressure. A further recovery of quotes to the key resistance level of 0.5997 seems likely, overcoming which will open the way to the area of 0.6055–0.6175.
Support and resistance
Support levels: 0.5919, 0.5825, 0.5771.
Resistance levels: 0.5997, 0.6055, 0.6117, 0.6175.
Trading tips
Long positions can be opened above 0.5997 with targets of 0.6055, 0.6117, 0.6175. Stop-loss — 0.5958. Implementation time: 9-12 days.
Short positions can be opened below the level of 0.5919 with targets at 0.5825, 0.5771. Stop-loss — 0.5958.


Hot
No comment on record. Start new comment.