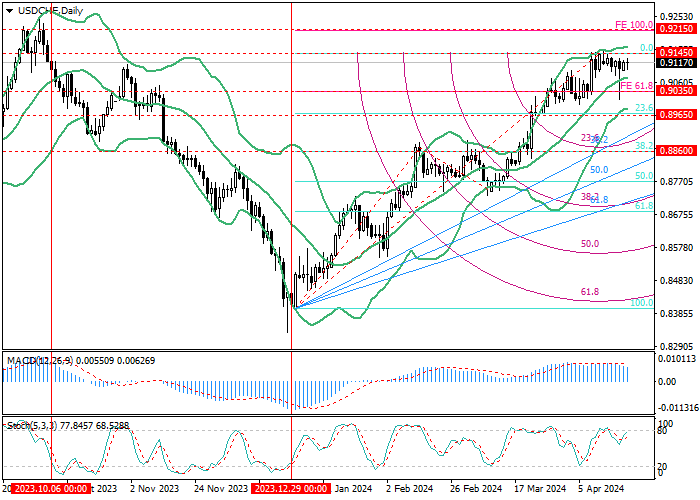
USD/CHF, D1
On the D1 chart, the USD/CHF pair is growing within the medium-term uptrend: last week, quotes reached their highest values since October 2022 around 0.9145 (0.0% correction). If this level is broken out, the uptrend will continue with the target of 0.9215 (100.0% expansion), otherwise the decline in quotes will resume to 0.8965 (23.6% correction) and 0.8860 (38.2% correction).
Technical indicators confirm the likelihood of further growth: Bollinger Bands and Stochastic are reversing up, MACD histogram is stable in the positive zone.

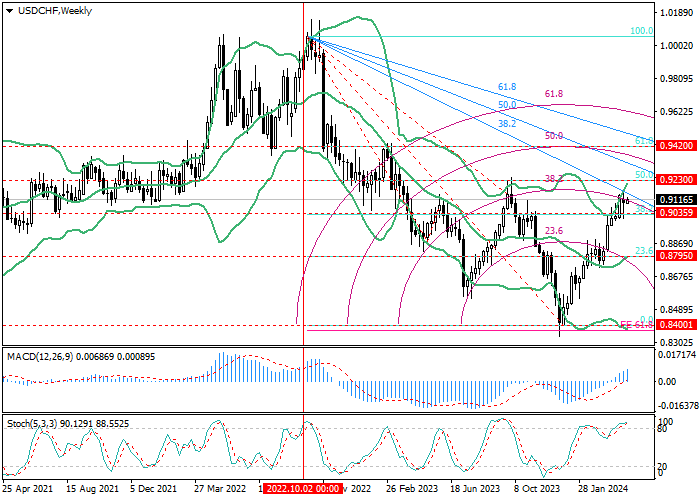
USD/CHF, W1
On the W1 chart, the price is adjusted to a long-term downtrend: quotes reversed around 0.8400 (0.0% correction) and have now consolidated above the level of 0.9035 (38.2% correction). Further growth is possible towards the targets of 0.9230 (50.0% correction) and 0.9420 (61.8% correction), but for this the instrument will have to break through the descending fan. With a reverse breakdown of the level of 0.9035, the decline may resume to 0.8795 (23.6% correction, the central line of Bollinger Bands).
Technical indicators allow for an increase in upward dynamics: Bollinger Bands and Stochastic are reversing up, MACD is stable in the positive zone.
Support and resistance
Currently, the continuation of the growth of the trading instrument seems more likely. If the level of 0.9145 is broken up (0.0% correction, D1), its targets will be 0.9230 (50.0% correction, W1; 100.0% expansion, D1) and 0.9420 (61.8% correction, W1). If the level of 0.9035 is broken down (38.2% correction, W1; 61.8% expansion, D1), the downward dynamics can resume to 0.8860 (38.2% correction, D1) and 0.8795 (23.6% correction, W1).
Resistance levels: 0.9145, 0.9230, 0.9420.
Support levels: 0.9035, 0.8860, 0.8795.
Trading tips
Long positions can be opened above 0.9145 with targets of 0.9230, 0.9420 and stop-loss around 0.9100. Implementation period: 5–7 days.
Short positions can be opened below the 0.9035 mark with targets of 0.8860, 0.8795 and stop-loss around 0.9090.


Hot
No comment on record. Start new comment.