Current trend
The AUD/USD pair shows weak growth, developing the "bullish" momentum formed the day before. The instrument is testing 0.6450 for a breakout, updating local highs from April 15 and receiving support from macroeconomic data.
The Australian Manufacturing PMI from S&P Global in April rose from 47.3 points to 49.9 points, and the Services PMI from Commonwealth Bank decreased from 54.4 points to 54.2 points, while the Composite PMI strengthened from 53.3 points to 53.6 points. With the opening of the American session, investors expect the publication of similar statistics from the United States: it is expected that the Manufacturing PMI will adjust from 51.9 points to 52.0 points, and the Services PMI – from 51.7 points to 52.0 points. Inflation data will be presented in Australia on Wednesday. Market expectations suggest that the Consumer Price Index will accelerate in the first quarter from 0.6% to 0.8%, and in annual terms it will decrease from 4.1% to 3.4%.
Investors' attention is focused on comments from US Federal Reserve officials regarding the regulator's further actions. Thus, the President of the Federal Reserve Bank (FRB) of Chicago, Austan Goolsbee, said that the rate of decline in inflation has slowed down significantly, and against the backdrop of a strong labor market, this makes the continued maintenance of "hawkish" monetary policy appropriate. In addition, he noted that persistent inflation rates and the stability of the labor market may be a sign of economic overheating, and did not rule out a new increase in borrowing costs if necessary.
Support and resistance
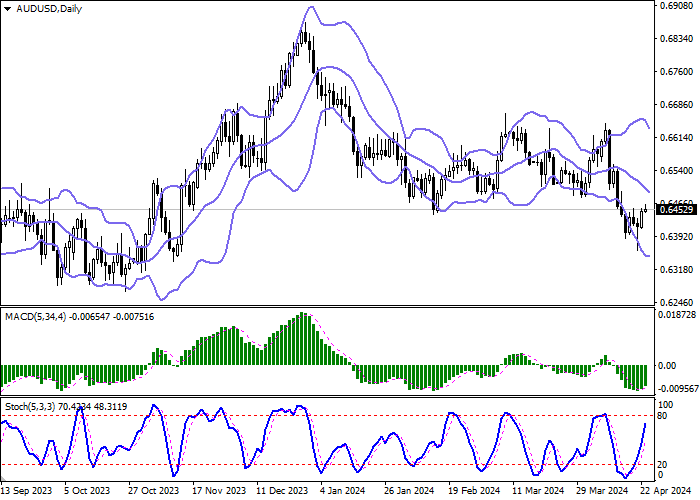
Bollinger Bands on the daily chart show a steady decline. The price range is narrowing from above, remaining spacious enough for the current activity level in the market. MACD has reversed to growth having formed a new buy signal (located above the signal line). Stochastic grows more steadily but is rapidly approaching its highs, which reflects risks of the overbought Australian dollar in the ultra-short term.
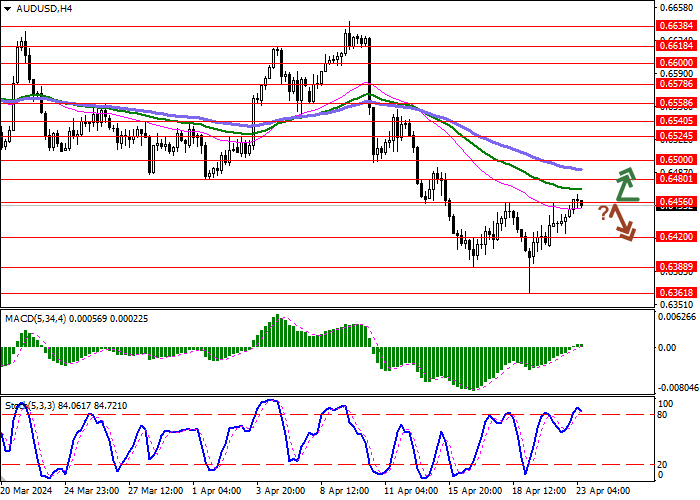
Resistance levels: 0.6456, 0.6480, 0.6500, 0.6524.
Support levels: 0.6420, 0.6388, 0.6361, 0.6300.
Trading tips
Long positions can be opened after a breakout of 0.6456 with the target of 0.6500. Stop-loss — 0.6430. Implementation time: 1-2 days.
A rebound from 0.6456 as from resistance, followed by a breakdown of 0.6420 may become a signal for opening of new short positions with the target at 0.6361. Stop-loss — 0.6450.


Hot
No comment on record. Start new comment.