Current trend
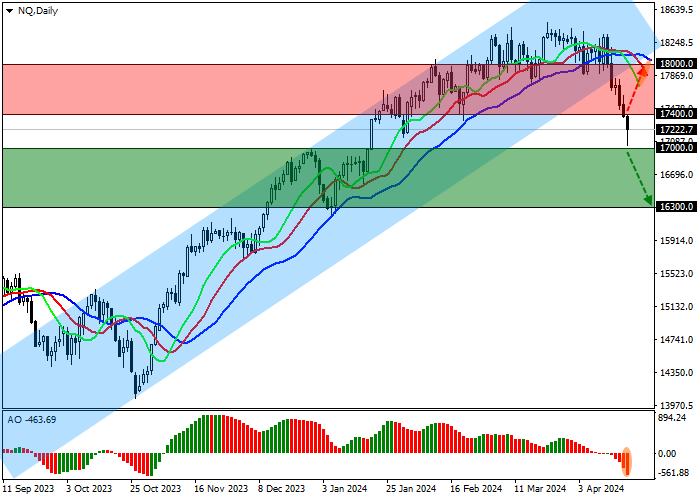
One of the leading US indices, the NQ 100, is showing corrective dynamics at 17222.0 against the backdrop of continued growth in the bond market, as well as rather weak reports from component companies.
The day before, the financial results of the video streaming service Netflix Inc. were published, reflecting revenue of 9.37 billion dollars, which exceeded the 9.27 billion dollars expected by analysts, while earnings per share rose to 5.28 dollars from 2.11 dollars with preliminary estimates of 4.51 dollars.
Today, data from the hygiene products concern The Procter & Gamble Co., as well as the financial services corporation American Express Co., will be presented. The Procter & Gamble Co. is forecast to report a decline in revenue to 20.44 billion dollars from 21.40 billion dollars previously, while earnings per share will fall to 1.41 dollars from 1.84 dollars. In turn, American Express Co. is expected to show more positive results: the company's revenue is expected to be 15.79 billion dollars, which compares with 15.80 billion dollars recorded a quarter ago, and earnings per share could increase to 2.95 dollars from 2.62 dollars in the previous quarter.
The growth leaders in the index are PepsiCo Inc. ( 1.65%), American Electric Power Co. Inc. ( 1.62%), Comcast Corp. ( 1.59%), Meta Platforms Inc. ( 1.54%).
Among the leaders of the decline are Micron Technology Inc. (-3.78%), Tesla Inc. (-3.55%), NXP Semiconductors NV (-3.34%).
Support and resistance
On the daily chart, the index quotes continue correction, which has gone beyond the ascending corridor of 19000.0–17500.0.
Technical indicators have already reversed and issued a new sell signal, which is getting stronger every day: fast EMAs on the Alligator indicator are significantly below the signal line, and the AO oscillator histogram is forming new corrective bars falling in the sell zone.
Support levels: 17000.0, 16300.0.
Resistance levels: 17400.0, 18000.0.

Trading tips
If the asset continues declining and the price consolidates below the support level of 17000.0, short positions can be opened with the target at 16300.0. Stop-loss — 17500.0. Implementation time: 7 days and more.
If the asset continues growing and consolidates above 17400.0, long positions with the target at 18000.0 will be relevant. Stop-loss — 17000.0.


Hot
No comment on record. Start new comment.