Current trend
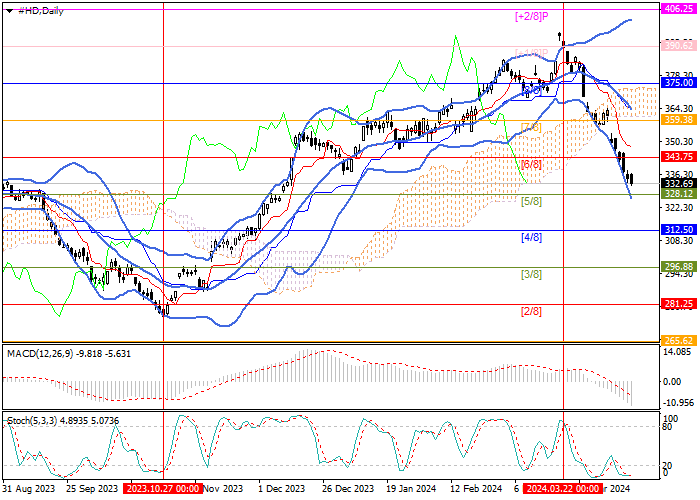
Shares of The Home Depot Inc., the largest home improvement company, have been correcting to the long-term uptrend for the fourth week. During this time, the price reversed downwards from 390.62 (Murrey level [ 1/8]), returned to Murrey’s main trading range, and is now close to 328.12 (Murrey level [5/8]), after consolidating below which it is possible to reach the area of 312.50 (Murrey level [4/8]) and 296.88 (Murrey level [3/8]). A breakout of the key “bullish” level of 359.38 (Murrey level [7/8]), supported by the middle line of Bollinger Bands, will allow the price grow to the upper limit of Murrey’s trading range at 375.00 (Murrey level [8/8]) and further into the reversal zone 390.62 (Murrey level [ 1/8]) and 406.25 (Murrey level [ 2/8]).
Technical indicators confirm the downward trend development: Bollinger Bands and Stochastic are directed downwards, and the MACD histogram is increasing in the negative zone.
Support and resistance
Resistance levels: 359.38, 375.00, 390.62, 406.25.
Support levels: 328.12, 312.50, 296.88.

Trading tips
Short positions may be opened below 328.12, with the targets at 312.50, 296.88, and stop loss 339.00. Implementation time: 5–7 days.
Long positions may be opened above 359.38, with the targets at 375.00, 390.62, 406.25, and stop loss 348.00.


Hot
No comment on record. Start new comment.