We present a medium-term investment review of the GBP/USD pair.
The UK economy remains under pressure from high inflation, and analysts consider most of the Bank of England’s measures to slow down its pace as ineffective, as the current correction develops against a decline in electricity exchange prices. However, with the recent oil price increase, a resumption of upward dynamics is possible. The regulator’s interest rate is 5.25%, and almost none of the experts doubt that at the meeting on May 9, it will stay at the same level. The March consumer price index moved from 3.4% to 3.2%, and the core value excluding food and fuel prices remained at 4.2%. The consumption sector is also putting pressure on the pound: in February, the core retail sales index rose 0.2% from 3.4% earlier MoM and fell 0.5% compared to a 0.5% increase in the previous period but retail sales remained unchanged in February, adjusting by –0.4% YoY, while gross domestic product (GDP) fell from 0.3% to 0.1% in the same period.
The American dollar has been trading in an upward trend for the second week, currently at 106.00 in USDX against US Fed interest rates remaining in the range of 5.25–5.50%. The head of the regulator, Jerome Powell, announced that the dates and goals of the new “dovish” cycle will be announced at a meeting on May 1. The less time left until the end of the year, the sharper the expected reduction in borrowing costs could be. Despite inflation rising from 3.2% to 3.5%, the core consumer price index consolidated at 3.8%, reinforcing the potential for a downward trend.
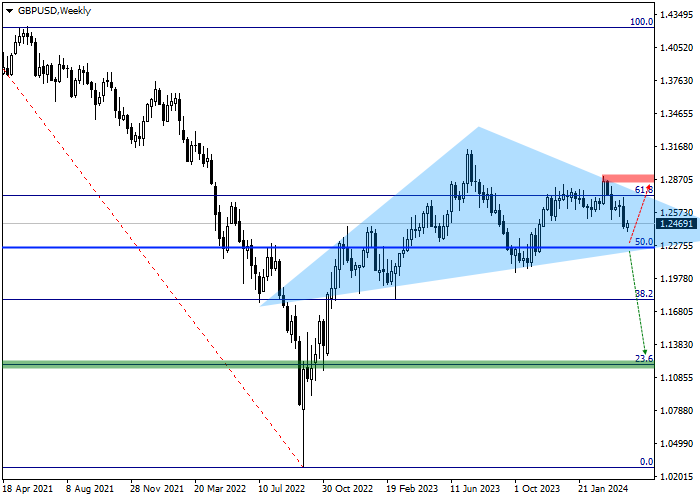
Technical indicators on the weekly chart record the movement of the instrument within the Head and shoulders reversal pattern with the Neckline at 1.2270.

Over the past month, the formation of the second Shoulder of the Head and shoulders reversal pattern has become increasingly obvious, the Neckline of which coincides with the 50.0% Fibonacci intermediate retracement level at 1.2260.
We suggest considering key levels on a daily chart.
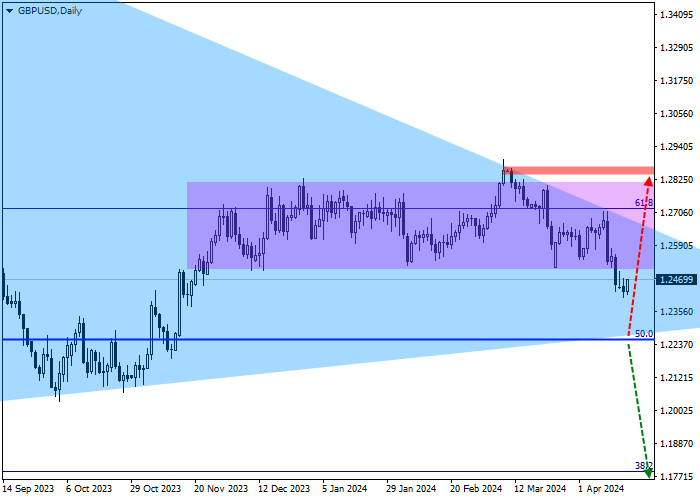
On the daily chart, the quotes left the sidewards channel of 1.2840–1.2500, which had been formed over the past five months, breaking the support line. If 1.2830 is reached, located just above the full correction level of 61.8%, the global downward scenario will be canceled and short positions should be liquidated. Around the initial correction level of 23.6% Fibonacci, located at 1.1200, there is the target zone, if reached, profit should be taken on open sell positions.
Trade entry levels may be assessed in more detail on the four-hour chart.
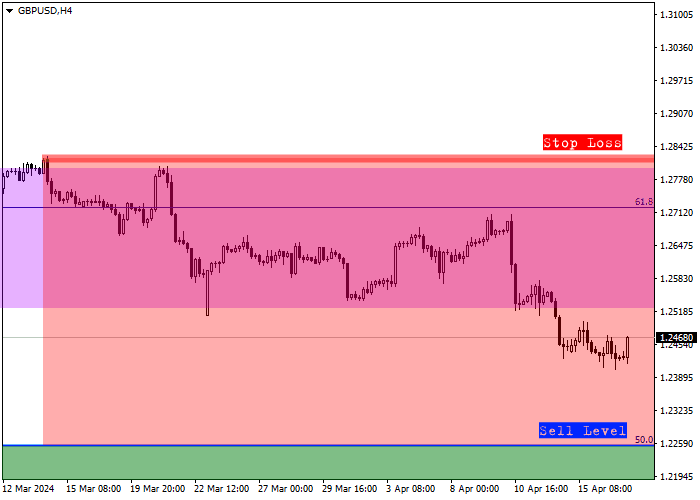
The entry level for sell transactions is at 1.2260, which coincides with the intermediate correction level of 50.0% Fibonacci, and a local signal can be received as early as this week when the current week’s low is overcome and consolidated below the intermediate correction level of 50.0 % according to Fibonacci, which will provide the necessary confirmation for the formation of global sell positions.
Considering the average daily volatility of the GBP/USD pair over the past month, which averages 56.3 points, the movement to the target zone around 1.1200 could take approximately 59 trading sessions but with increasing volatility, this time could be reduced to 49 days.


Hot
No comment on record. Start new comment.