Current trend
The USDX index continues its weak growth during the morning session, building on the strong "bearish" impetus formed last week and updating the local highs of early November 2023. The instrument is testing 106.15 for a breakout, although the day before it was approaching 106.30.
Macroeconomic statistics published yesterday exerted some pressure on the dollar: the Building Permits in March decreased by 4.3% after an increase of 2.3% in the previous month. In absolute terms, the figure dropped from 1.523 million to 1.458 million, while analysts expected 1.514 million. The Housing Starts lost 14.7% after increasing by 12.7% in February, and in absolute terms, the figure decreased from 1.549 million to 1.321 million, with a forecast of 1.480 million. Meanwhile, Industrial Production maintained its growth rate of 0.4%, as analysts had expected, and the Capacity Utilization adjusted from 78.2% to 78.4%, compared with preliminary estimates of 78.5%.
The focus of investors today will be the publication of a monthly economic report from the US Federal Reserve, the Beige Book, which characterizes the state of the economy in the twelve federal districts of the country and contains information on all types of industry, agriculture, corporate and consumer spending, the real estate market and other indicators at the moment. Experts predict that the report will be positive, increasing doubts about the advisability of a quick reduction in borrowing costs. Markets are now forecasting only two interest rate adjustments this year, with the first one no longer expected in June.
Support and resistance
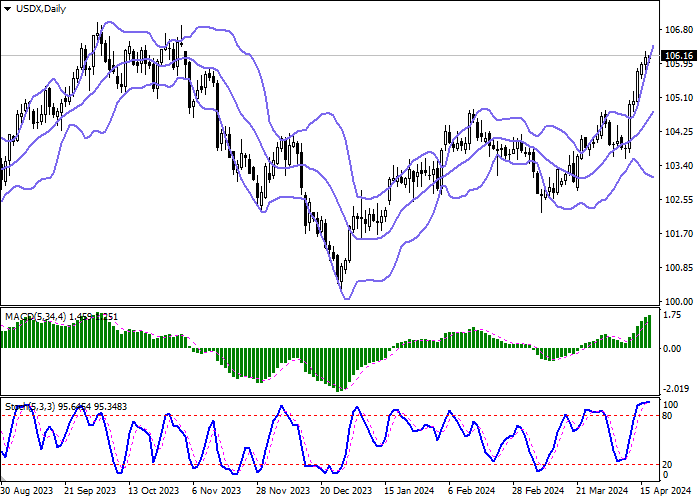
Bollinger Bands on the daily chart show a steady increase. The price range is expanding, but it is not keeping pace with the activity of the "bulls" in the short term yet. MACD indicator is growing, while preserving a rather stable buy signal (located above the signal line). Stochastic approached its highs and reversed into a horizontal plane, indicating the risks of the USDX being overbought in the ultra-short term.
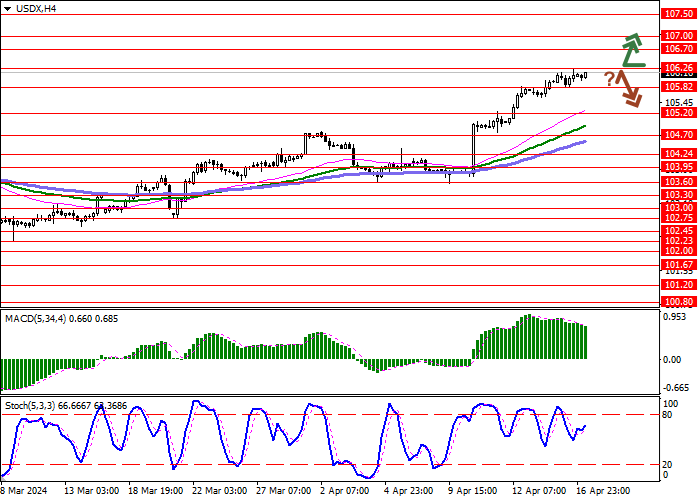
Resistance levels: 106.26, 106.70, 107.00, 107.50.
Support levels: 105.82, 105.20, 104.70, 104.24.
Trading tips
Long positions can be opened after a breakout of 106.26 with the target of 107.00. Stop-loss — 105.82. Implementation time: 1-2 days.
A rebound from 106.26 as from resistance, followed by a breakdown of 105.82 may become a signal for opening of new short positions with the target at 104.70. Stop-loss — 106.26.


Hot
No comment on record. Start new comment.