Current trend
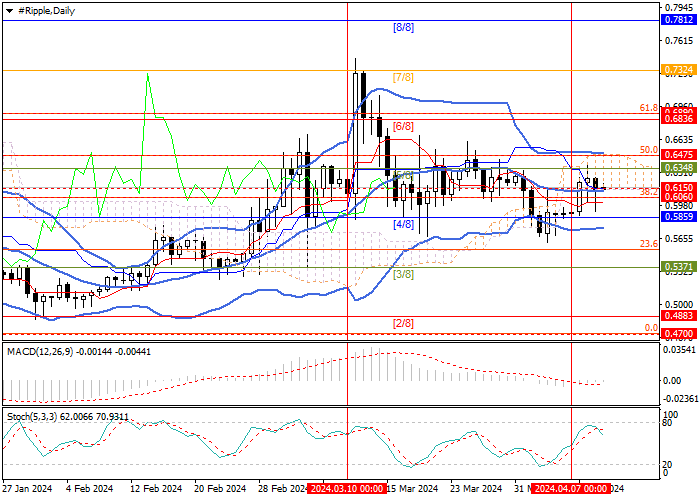
The XRP/USD pair is trading within a long-term sideways range of 0.6890–0.4700 (Fibonacci retracement 61.8%, Murrey level [6/8] – Fibonacci retracement 0.0%). This week, the price attempted to grow within the general market trend, rising to the area of 0.6414; however, against the backdrop of the publication of American inflation data, it lost its gained positions.
Currently, the price is testing the support zone 0.6150–0.6060 (center line of Bollinger Bands, Fibonacci retracement 38.2%), consolidation below which will allow the decline to resume towards targets 0.5371 (Murrey level [3/8]), 0.4883 (Murrey level  /8]), 0.4700 (Fibonacci retracement 0.0%, area of the lower border of the long-term sideways range). The key level for the "bulls" is 0.6475 (Fibonacci retracement 50.0%), consolidation above which can lead to an increase in quotes to the levels of 0.6890 (Fibonacci retracement 61.8%, Murrey level [6/8]) and 0.7324 (Murrey level [ 7/8]).
Technical indicators don't provide a clear signal: Bollinger Bands are horizontal, MACD is at the zero area, and its volumes are insignificant; however, Stochastic is reversing downwards from the overbought zone, which does not exclude the development of a downward movement.
Support and resistance
Resistance levels: 0.6475, 0.6890, 0.7324.
Support levels: 0.6060, 0.5371, 0.4883, 0.4700.
Trading tips
Short positions could be opened below 0.6060 with targets at 0.5371, 0.4883, 0.4700 and stop-loss at 0.6400. Implementation period: 5-7 days.
Long positions can be opened above 0.6475 with targets at 0.6890, 0.7324 and stop-loss at 0.6230.


Hot
No comment on record. Start new comment.