Current trend
The XAG/USD pair is again showing growth, recovering from a corrective decline the day before, which did not allow the instrument to consolidate at new record highs.
The reason for the appearance of negative dynamics the day before was the March data on inflation in the United States, which increased doubts regarding the proposed easing of monetary parameters by the US Federal Reserve in June: the Consumer Price Index in annual terms increased from 3.2% to 3.5% with a forecast of 3.4%, and in monthly terms the indicator added 0.4%, while analysts expected 0.3%. Core CPI excluding Food and Energy remained at the same level of 3.8% against expectations of 3.7%.
Investors also paid attention to the results of the meetings of the Reserve Bank of New Zealand and the Bank of Canada: as expected, both regulators kept the interest rate at the same level, which further strengthened investors’ doubts regarding the pace of monetary policy easing by the world’s leading central banks in the second half of the current year.
Today at 15:15 (GMT 2) traders will evaluate the results of the meeting of the European Central Bank (ECB), from which no changes in monetary parameters are expected. In addition, in the United States at 15:30 (GMT 2) March data on producer inflation will be presented: the PPI is likely to rise from 1.6% to 2.2% in annual terms and decrease from 0.6% to 0.3% in monthly terms. The Core Producer Price Index excluding Food and Energy could accelerate from 2.0% to 2.3%.
There is a correction in the market of silver contracts. According to the report of the US Commodity Futures Trading Commission (CFTC), last week the number of net speculative positions in precious metal increased to 53.1 thousand from 50.8 thousand a week earlier. The "bulls" maintain an advantage: the number of their positions secured by real money is 58.160 thousand versus 24.076 thousand for the "bears". Last week, buyers opened 4.377 thousand new contracts, and sellers opened 0.476 thousand.
Support and resistance
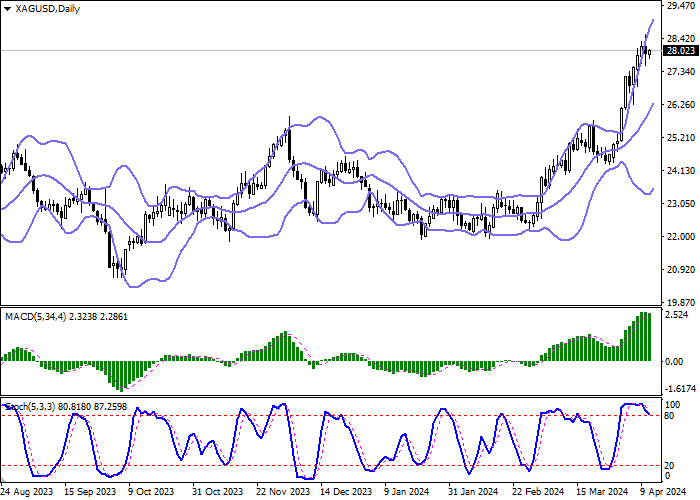
Bollinger Bands on the daily chart show a steady increase. The price range expands, freeing a path to new record highs for the "bulls". MACD is reversing downwards keeping a previous buy signal (located above the signal line). Stochastic, having retreated from its highs, develops downward dynamics, signaling in favor of a corrective decline in the near future.
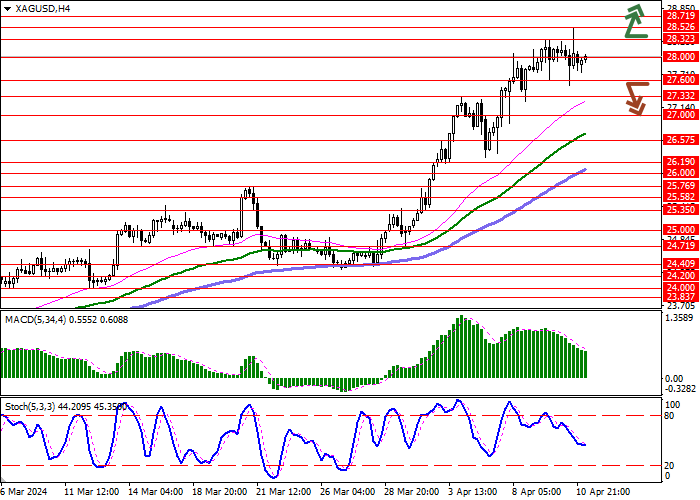
Resistance levels: 28.00, 28.32, 28.52, 28.71.
Support levels: 27.60, 27.33, 27.00, 26.57.

Trading tips
Long positions can be opened after a breakout of 28.32 with the target of 29.00. Stop-loss — 28.00. Implementation time: 2-3 days.
The return of a "bearish" trend with the breakdown of 27.60 may become a signal for new short positions with the target at 27.00. Stop-loss — 28.00.


Hot
No comment on record. Start new comment.