Current trend
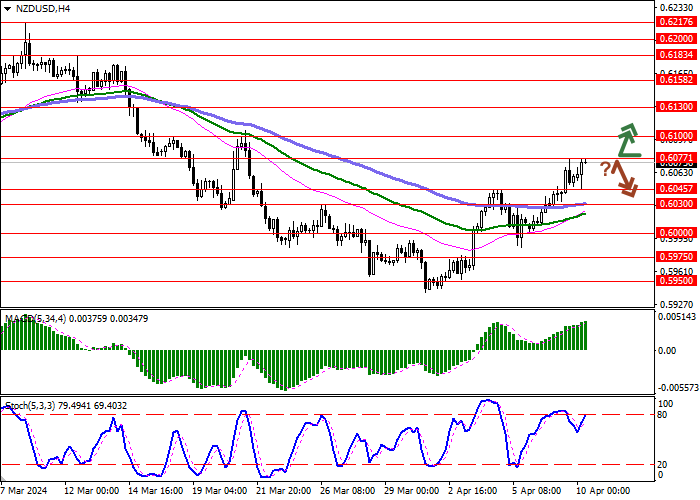
The NZD/USD pair shows moderate growth, developing the "bullish" momentum formed at the beginning of the week. The instrument is testing 0.6075 for a breakout, updating local highs from March 21 against the backdrop of decisions by the Reserve Bank of New Zealand on monetary policy.
As expected, the interest rate was kept at 5.50%, and in the follow-up statement, officials noted that inflation risks remain significant, so borrowing costs will remain at barrier levels for a long time. Monetary authorities said they expect a further slowdown in economic activity both within the country and among its main trading partners, while the US economy, for example, has shown resilience. Apparently, the New Zealand regulator expects that some of the world's leading central banks will nevertheless begin easing monetary parameters in the middle or towards the end of the year, which will allow them to obtain more analytical data and then assess the market response.
The NZD/USD pair was put under some pressure yesterday by data from New Zealand: the Business Confidence index from the New Zealand Institute of Economic Research (NZIER) fell sharply by 25.0% in the first quarter after -2.0% in the previous period.
Investors' attention today will be focused on American inflation statistics: forecasts suggest an increase in annual dynamics from 3.2% to 3.4%. Many officials are already very skeptical about the imminent start of easing monetary policy: for example, the day before, a member of the US Federal Reserve Board of Governors, Michelle Bowman, and the President of the Federal Reserve Bank (FRB) of Dallas, Lorie Logan, stated that it was inappropriate to reduce the cost of borrowing due to the persistence of inflation risks. Thus, the end of the corrective growth of the NZD/USD pair in the near future seems quite possible.
Today at 20:00 (GMT 2), trading participants will pay attention to the March minutes of the meeting of the American regulator, which may more accurately reflect the current sentiments of members of the US Federal Open Market Committee (FOMC).
Support and resistance
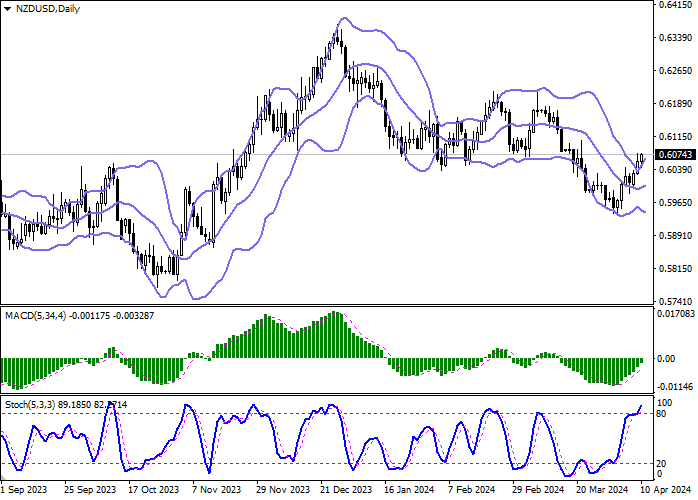
On the D1 chart, Bollinger Bands are gradually reversing to the ascending plane. The price range is expanding, but cannot keep up with the current surge in "bullish" sentiment. MACD grows, preserving a stable buy signal (located above the signal line). Stochastic retains an upward direction, but is located in close proximity to its highs, which points to the risk of overbought instrument in the ultra-short term.
Resistance levels: 0.6077, 0.6100, 0.6130, 0.6158.
Support levels: 0.6045, 0.6030, 0.6000, 0.5975.

Trading tips
Long positions can be opened after a breakout of 0.6077 with the target of 0.6130. Stop-loss — 0.6050. Implementation time: 1-2 days.
A rebound from 0.6077 as from resistance, followed by a breakdown of 0.6045 may become a signal for opening of new short positions with the target at 0.6000. Stop-loss — 0.6070.


Hot
No comment on record. Start new comment.