Shares of AT&T Inc., one of the largest American telecommunications conglomerates, are trading at 16.70.
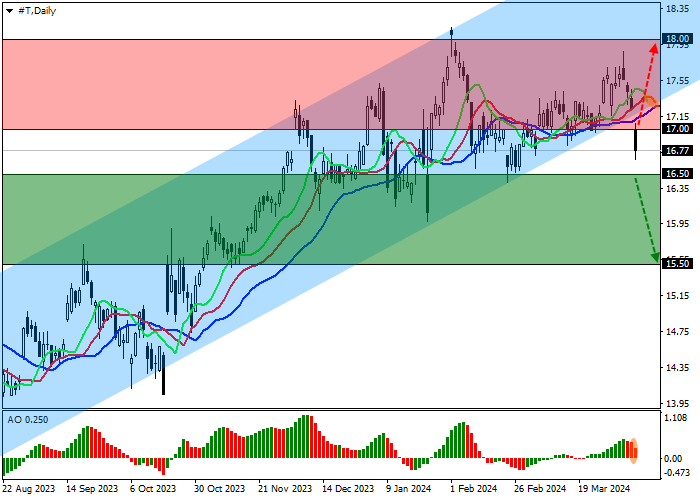
On the daily chart, the price is correcting, retreating from the support line of the ascending corridor with dynamic boundaries of 18.50–17.00.
On the four-hour chart, the quotes consolidated below the local low of 17.00 and the channel support line of 17.15. Consolidation below 16.30 will allow the asset to reach 15.00.
Technical indicators are weakening the buy signal: fast EMAs on the Alligator indicator are approaching the signal line, and the AO histogram is forming downward bars in the buy zone.
Trading tips
Short positions may be opened after the price declines and consolidates below 16.50, with the target at 15.50. Stop loss – 17.00. Implementation period: 7 days or more.
Long positions may be opened after the price rises and consolidates above 17.00, with the target at 18.00. Stop loss – 16.50.
Disclaimer: The content above represents only the views of the author or guest. It does not represent any views or positions of FOLLOWME and does not mean that FOLLOWME agrees with its statement or description, nor does it constitute any investment advice. For all actions taken by visitors based on information provided by the FOLLOWME community, the community does not assume any form of liability unless otherwise expressly promised in writing.


Hot
No comment on record. Start new comment.