Current trend
The leading US economy index S&P 500 is correcting at around 5212.0. The publication period for corporate reporting starts only at the end of the month, but for now the dynamics in the index depend on the situation on the bond market, which is in a stable upward trend.
The expectation of an early move by the US Federal Reserve to easing monetary policy also has a key impact on the stock market. However, strong data on the national labor market, which reflected a reduction in the Unemployment Rate in March to 3.8% from 3.9%, allows officials to postpone adjusting the parameters for at least one meeting, which is also confirmed by the Chicago Mercantile Exchange (CME) FedWatch Tool, which today issued forecasts of a 100.0% probability of maintaining borrowing costs at the level of 5.25-5.50% at the May 1 meeting. Consequently, the increased debt burden will not allow national companies to emerge from the local crisis for at least several more months.
The US bond market is showing a stable upward trend, which is a negative signal for the stock market: 10-year bonds are trading at a rate of 4.414%, which was last reached in early December last year, the yield on 20-year bonds is 4.648%, up from 4.557% recorded a week earlier, and the rate on 30-year securities adjusted to 4.543% from 4.478%.
The growth leaders in the index are Albemarle Corp. ( 6.67%), Camden Property Trust ( 5.69%), Tesla Inc. ( 4.90%), Mid-America Apartment Communities Inc. ( 4.44%).
Among the leaders of the decline are Paramount Global Class B (-7.60%), CF Industries Holdings Inc. (-6.26%), Fortinet Inc. (-3.55%).
Support and resistance
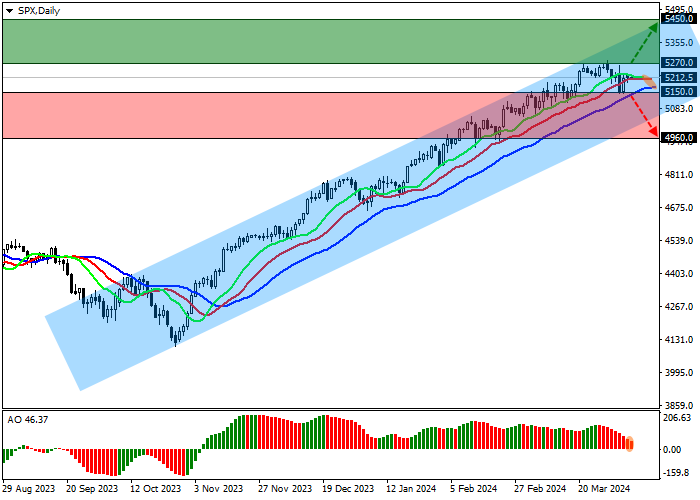
On the daily chart, quotes are moving in the direction of the resistance line of the ascending channel with boundaries of 5400.0–5050.0.
Technical indicators are holding a buy signal, which is still quite stable: fast EMAs on the Alligator indicator are moving away from the signal line, and the AO histogram, being in the buy zone, is forming ascending bars.
Support levels: 5150.0, 4960.0.
Resistance levels: 5270.0, 5450.0.

Trading tips
If the asset continues to grow and consolidates above the resistance level of 5270.0, buy positions with a target of 5450.0 will be relevant. Stop-loss — 5200.0. Implementation time: 7 days and more.
If the asset reverses and declines and the price consolidates below 5150.0, short positions can be opened with the target at 4960.0. Stop-loss — 5230.0.


Hot
No comment on record. Start new comment.