Current trend
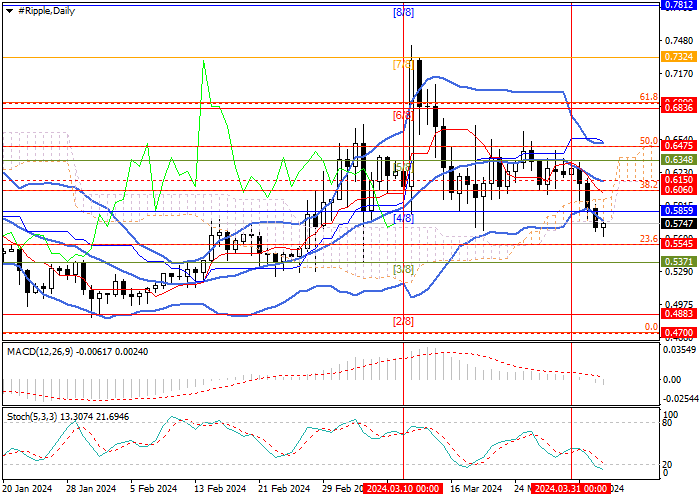
The XRP/USD pair is trading within the long–term lateral range of 0.6890–0.4700 (61.8% Fibonacci retracement, Murrey level [6/8]– 0.0%Fibonacci retracement), but this week resumed an active decline within the general market trend, and by now the quotes have lost about 9.0% in value, holding in the area of 0.5750.
Technical indicators confirm the formation of a short-term downtrend: Bollinger Bands and Stochastic are reversing down, and MACD is increasing in the negative zone. Based on this, further price declines may continue to 0.5371 (Murrey level [3/8]), 0.4883 (Murrey level [2/8]), 0.4700 (0.0% Fibonacci retracement, the area of the lower border of the long-term lateral channel). The key for the "bulls" is the resistance zone of 0.6060–0.6150 (38.2% Fibonacci retracement, the central line of Bollinger Bands), consolidating above which will allow the instrument to reach 0.6890 (61.8% Fibonacci retracement, Murrey level [6/8]) and 0.7324 (Murrey level [7/8]), but so far this scenario seems less likely.
Support and resistance
Resistance levels: 0.6150, 0.6890, 0.7324.
Support levels: 0.5371, 0.4883, 0.4700.

Trading tips
Short positions can be opened from 0.5660 with targets of 0.5371, 0.4883, 0.4700 and stop-loss of 0.5850. Implementation period: 5–7 days.
Long positions can be opened above 0.6150 with targets of 0.6890, 0.7324 and stop-loss of 0.5900.


Hot
No comment on record. Start new comment.