Shares of Amazon.com Inc., a leader in e-commerce, are trading at 182.00.
An upward trend is forming on the daily chart, within which the price is kept within an ascending corridor with dynamic boundaries of 193.00–175.00.
On the four-hour chart, the quotes have overcome the year’s high of 182.00 and are preparing to grow: the nearest obstacle is the channel resistance level of 195.00.
Technical indicators are holding a buy signal: the EMA fluctuation range on the Alligator indicator is expanding upward, and the AO histogram is forming ascending bars in the buy zone.
Trading tips
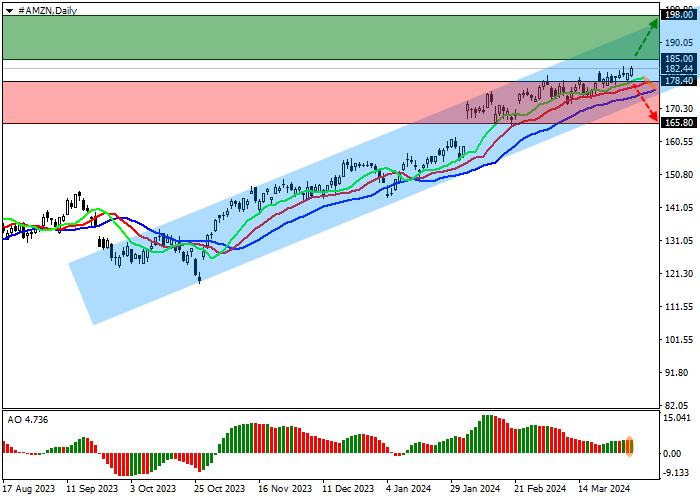
Long positions may be opened after the price rises and consolidates above 185.00, with the target at 198.00. Stop loss – 180.00. Implementation period: 7 days or more.
Short positions may be opened after the price declines and consolidates below 178.40, with the target at 165.80. Stop loss is below 182.00.
Disclaimer: The content above represents only the views of the author or guest. It does not represent any views or positions of FOLLOWME and does not mean that FOLLOWME agrees with its statement or description, nor does it constitute any investment advice. For all actions taken by visitors based on information provided by the FOLLOWME community, the community does not assume any form of liability unless otherwise expressly promised in writing.


Hot
No comment on record. Start new comment.