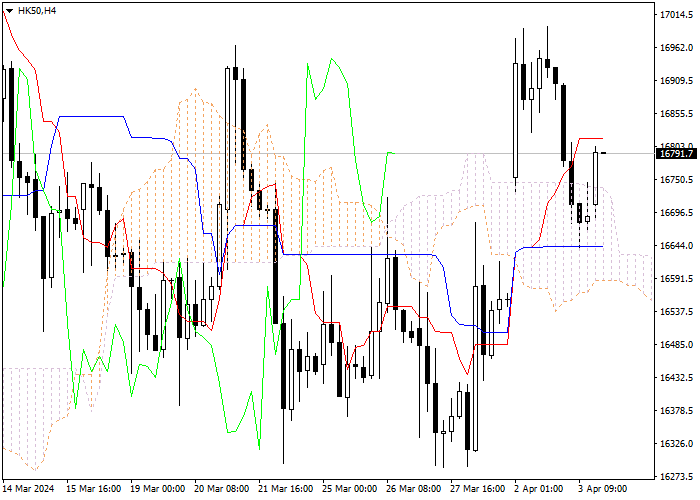
Mari kita lihat grafik empat jam. Garis Tenkan-sen berada di atas Kijun-sen, garisnya horizontal. Garis konfirmasi Chikou Span berada di atas grafik harga, awan saat ini telah berbalik dari turun ke naik. Instrumen ini diperdagangkan antara garis Tenkan-sen dan Kijun-sen. Garis Kijun-sen dan Tenkan-sen masing-masing telah menjadi level support (16641.2) dan resistance (16814.6)
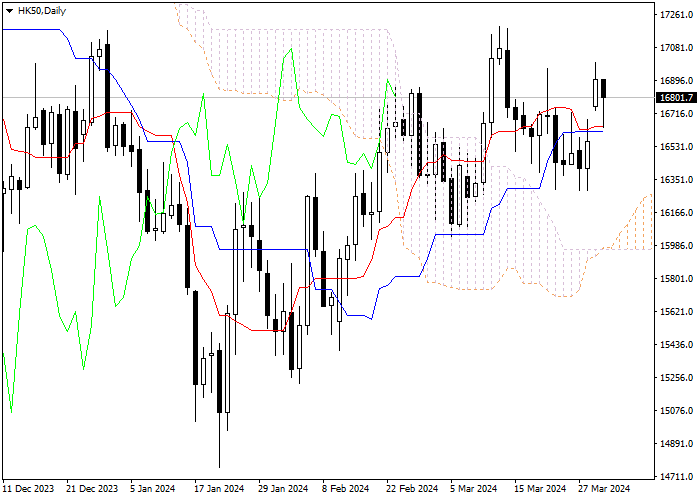
Pada grafik harian, garis Tenkan-sen dan Kijun-sen telah bergabung, garis-garisnya horizontal. Garis konfirmasi Chikou Span mendekati grafik harga dari atas, awan saat ini sedang naik. Instrumen ini diperdagangkan di bawah garis Tenkan-sen dan Kijun-sen; tren Bearish masih kuat. Level support terdekat adalah garis Tenkan-sen (15971.1). Level resistance terdekat adalah batas bawah cloud (17415.5).
Pada grafik empat jam kita bisa melihat koreksi pergerakan ke atas. Pada daily chart tren Bullish masih kuat. Disarankan untuk membuka posisi buy pada harga saat ini dengan Take Profit pada level maksimum sebelumnya di garis Chikou Span (17415.5) dan Stop Loss di level garis Kijun-sen (16609.4).
Disclaimer: The content above represents only the views of the author or guest. It does not represent any views or positions of FOLLOWME and does not mean that FOLLOWME agrees with its statement or description, nor does it constitute any investment advice. For all actions taken by visitors based on information provided by the FOLLOWME community, the community does not assume any form of liability unless otherwise expressly promised in writing.


Hot
No comment on record. Start new comment.