Current trend
The GBP/USD pair has been declining for the fourth week, trading at 1.2560.
Yesterday, the American dollar was supported by positive manufacturing PMI from the Institute for Supply Management (ISM), which recorded an increase from 52.5 points to 55.8 points in March, significantly exceeding the 53.3 points expected, while the new production orders index increased from 49.2 points to 51.4 points. The industry is recovering strongly, contributing to further increases in the national gross domestic product (GDP) and continued risks of slowing inflation. Against this background, the GBP/USD pair dropped to 1.2540.
Today, the asset regained some of its lost ground after the publication of positive British macroeconomic statistics: manufacturing PMI increased from 47.5 points to 50.3 points and entered the growth zone for the first time since July 2022. At the same time, according to the British building society Nationwide Building Society, house prices increased by 1.6% in March, indicating a recovery in the real estate market. Experts from the British Retail Consortium (BRC) reported an increase in consumer prices in the country’s largest stores by 1.3%, significantly below the target level of 2.0%. In general, the recovery of the national economy, combined with weakening inflation, allows Bank of England officials to move on to adjusting monetary policy soon. The likelihood that it will decrease the interest rates in May, earlier than the US Fed, remains a long-term negative factor for the pound.
Support and resistance
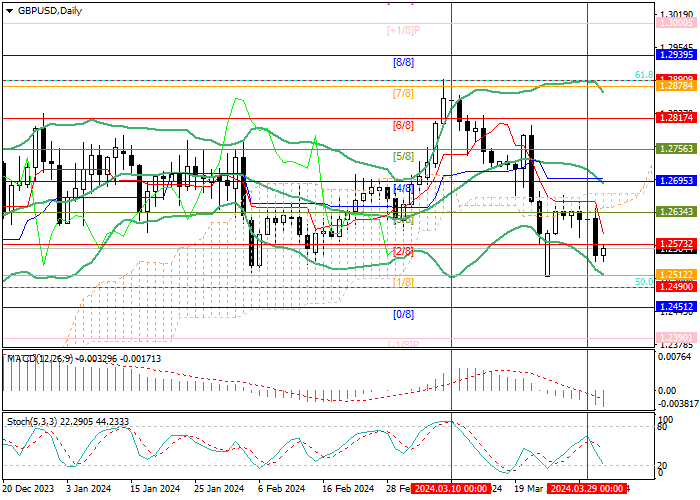
The trading instrument dropped below 1.2573 (Murrey level [2/8]), which will allow it to reach the area of 1.2451 (Murrey level [0/8]), 1.2390 (Murrey level [–1/8]). In the event of a breakout of the key “bullish” level of 1.2695 (Murrey level [4/8]), supported by the middle line of Bollinger bands, growth to the area of 1.2817 (Murrey level [6/8]), 1.2890 (Fibonacci correction 61.8%) is expected.
Technical indicators confirm a downward trend: Bollinger Bands and Stochastic are directed downwards, and the MACD histogram is increasing in the negative zone.
Resistance levels: 1.2695, 1.2817, 1.2890.
Support levels: 1.2451, 1.2390.
Trading tips
Short positions may be opened from 1.2540, with the targets at 1.2451, 1.2390, and stop loss 1.2595. Implementation time: 5–7 days.
Long positions may be opened above 1.2695, with the targets at 1.2817, 1.2890 and stop loss 1.2650.


Hot
No comment on record. Start new comment.