Current trend
The ETH/USD pair started the week with a decline, trading around 3380.00, within the framework of a general market trend, probably caused by partial profit-taking by ordinary traders and low activity of institutional investors due to the Easter holidays. So, on Monday, there was again a small outflow of funds from the bitcoin ETF, which amounted to 85.7 million dollars.
The uncertain situation with the launch of spot ETFs based on the second cryptocurrency is putting additional pressure directly on ETH. If at the beginning of the year many experts believed that the U.S. Securities and Exchange Commission (SEC) would approve new products in May, after the deadline for making a decision on the first such application from VanEck, now there is no such certainty. The change in market sentiment is due to the lack of contacts between the regulator and companies interested in ETFs, as well as new legal problems that may arise for the Ethereum Foundation and the ETH token itself. Last month, the SEC sent out requests to several companies to provide financial documentation on cooperation with the fund. Experts fear that all these actions are part of the preparatory measures in order to recognize ETH as a security, especially since last year the head of the regulator, Gary Gensler, already hinted that the transition of the Ethereum network to the Proof-of-Stake algorithm could be the basis for such a decision, but then these warnings were not perceived by the market seriously. Now, there is a possibility that this situation may make it difficult or even prevent the launch of an ETH-based ETF.
Generally, in the near future, the ETH/USD pair is likely to be influenced by two opposite factors. Pressure on it will be exerted by the demands of American officials, but a significant decrease will be hindered by the expectation of halving the BTC network and the associated general increase in investor attention to the digital assets market.
Support and resistance
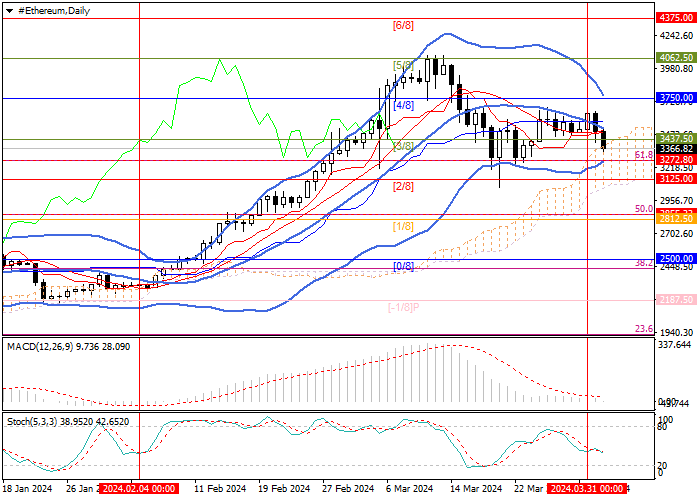
The ETH/USD pair fell below the central line of Bollinger Bands and is close to the support zone of 3272.80–3125.00 (61.8% Fibonacci retracement, Murrey level [2/8]), the breakdown of which will allow the decline to continue to 2855.00 (50.0% Fibonacci retracement, Murrey level [1/8]) and 2500.00 (28.2% Fibonacci retracement, Murrey level [0/8]). The key for the "bulls" is the 3750.00 mark (Murrey level [4/8]), consolidation above which will ensure the resumption of growth towards the targets of 4062.50 (Murrey level [5/8]), 4375.00 (Murrey level [6/8]).
Technical indicators allow for continued price decline in the medium term: Bollinger Bands and Stochastic are reversing down, and MACD is preparing to move into the negative zone.
Resistance levels: 3750.00, 4062.50, 4375.00.
Support levels: 3125.00, 2855.00, 2500.00.
Trading tips
Short positions can be opened below 3125.00 with targets of 2855.00, 2500.00 and stop-loss of 3500.00. Implementation period: 5–7 days.
Long positions may be opened above 3750.00 with targets at 4062.50, 4375.00 and stop-loss at 3350.00.


Hot
No comment on record. Start new comment.