Current trend
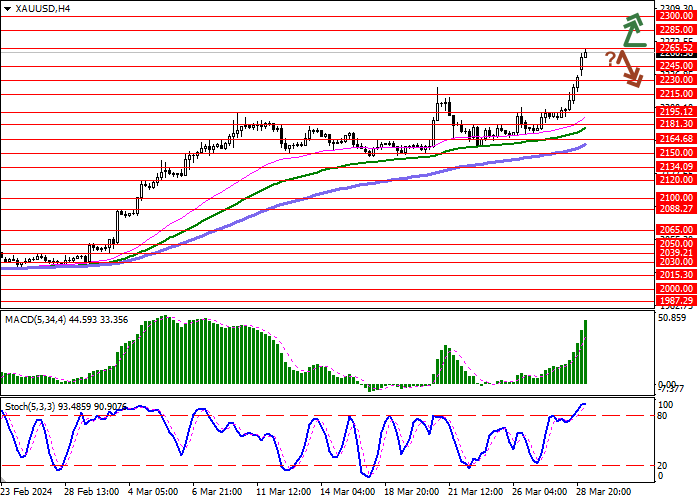
The XAU/USD pair shows rapid growth during the Asian session, developing the "bullish" dynamics of last week and updating record highs: the instrument is testing 2260.00 for a breakout, while activity on the market remains subdued.
European trading markets are closed today due to the Easter holidays, but investors await the release of March business activity data from S&P and the Institute of Supply Management (ISM) in the US at 16:00 (GMT 2). Forecasts suggest an increase in the ISM Manufacturing PMI index from 47.8 points to 48.4 points, while the indicator from S&P Global is likely to remain unchanged at 52.5 points. At the end of the week, the US will present the March labor market report: it is expected that the Nonfarm Payrolls will decrease from 275.0 thousand to 200.0 thousand, the Average Hourly Earnings will adjust from 0.1% to 0.3% in monthly terms and from 4.3% to 4.1% in annual terms, and the Unemployment Rate will remain at 3.9%.
The positive dynamics of the XAU/USD pair quotations is also facilitated by an increase in demand for physical gold from global central banks, which are increasing reserves in anticipation of a change in the rhetoric of the US Federal Reserve and other regulators. Analysts still assume a possible reduction in the interest rate by the American monetary authorities in June, and in total at least three adjustments to the value are expected by the end of 2024. The European Central Bank and Bank of England are likely to move to cut borrowing costs only in August.
Meanwhile, the correction continues on the gold contracts market. According to the report of the US Commodity Futures Trading Commission (CFTC), last week the number of net speculative positions in precious metal decreased to 199.3 thousand from 201.6 thousand a week earlier. The exit of sellers from the asset is recorded: the balance in positions secured by real money amounted to 183.265 thousand for the "bulls" versus 25.545 thousand for the "bears". Last week, buyers reduced the number of contracts by 3.416 thousand, and sellers - by 3.669 thousand, indicating a continued pause in gaining long positions.
Support and resistance
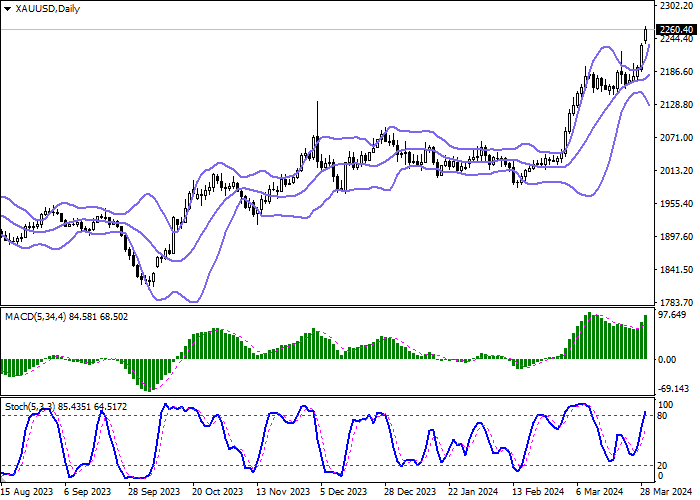
Bollinger Bands in D1 chart show active growth. The price range is expanding but it fails to conform to the surge of "bullish" sentiments at the moment. MACD grows, preserving a stable buy signal (located above the signal line). Stochastic keeps its upward direction but is rapidly approaching its highs, which reflects the risks of overbought gold in the ultra-short term.
Resistance levels: 2265.52, 2285.00, 2300.00, 2320.00.
Support levels: 2245.00, 2230.00, 2215.00, 2195.12.

Trading tips
Long positions can be opened after a breakout of 2265.52 with the target of 2300.00. Stop-loss — 2245.00. Implementation time: 1-2 days.
A rebound from 2265.52 as from resistance, followed by a breakdown of 2245.00 may become a signal for opening of new short positions with the target at 2215.00. Stop-loss — 2265.52.


Hot
No comment on record. Start new comment.