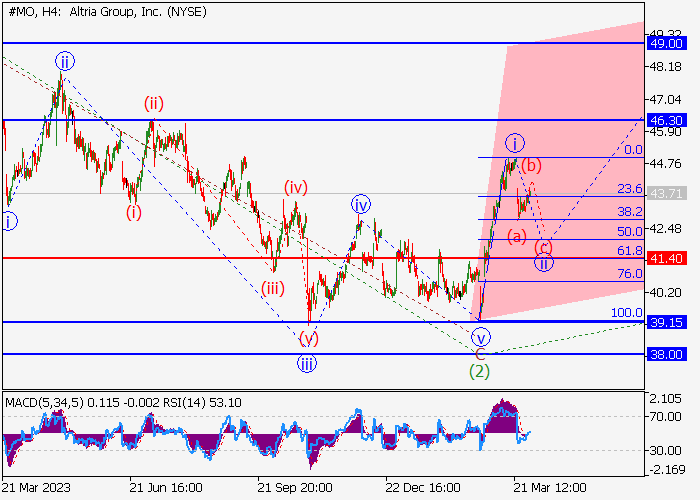
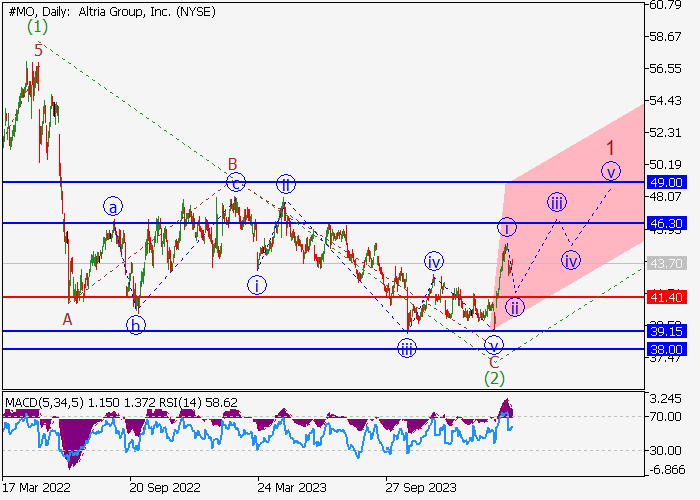
On the daily chart, the first wave of the higher level (1) ended, and a downward correction formed as the second wave (2), within which the wave C of (2) developed. Now, the third wave (3) has started, within which the entry first wave of the lower level i of 1 of (3) has developed, and a local correction is developing as the second wave ii of 1 of (3). If the assumption is correct, after the correction the asset will grow to the area of 46.30–49.00. In this scenario, critical stop loss level is 41.40.
Main scenario
Long positions will become relevant above the level of 41.40 with the targets at 46.30–49.00. Implementation period: 7 days and more.
Alternative scenario
A breakout and the consolidation of the price below the level of 41.40 will let the asset go down to the area of 39.15–38.00.
Disclaimer: The content above represents only the views of the author or guest. It does not represent any views or positions of FOLLOWME and does not mean that FOLLOWME agrees with its statement or description, nor does it constitute any investment advice. For all actions taken by visitors based on information provided by the FOLLOWME community, the community does not assume any form of liability unless otherwise expressly promised in writing.


Hot
No comment on record. Start new comment.