USDX: QUARTERLY REVIEW


Today, we present you a mid-term investment overview of USDX, the index of the ratio of the value of the US dollar to a basket of the world's base currencies.
Following the results of the last meeting of the US Federal Reserve, the key rate was maintained at the level of 5.25–5.50%. The head of the department, Jerome Powell, said that at least 3 decreases in this value should be expected by the end of the year, but the first of them is likely to occur no earlier than June. The labor market is still under pressure from high interest rates, in particular, the average value of initial jobless claims ranges from 200.0 thousand to 215.0 thousand. At the same time, there has been a slight increase in the real estate market: sales in the secondary housing market jumped to 4.38 million in February from 4.00 million in January, and this is already significantly higher than at the end of last year at 3.70–3.80 million. The inflation rate is also assessed inextricably with interest rates, which increased from 3.1% to 3.2% in February, while the basic consumer price index continued its local decline and fell from 3.9% to 3.8%, which is still very far from the target 2.0%.
The lateral correction in the bond market has an additional impact on the USDX: the correlation of the dollar index and key bonds is close to one, and a drop in bond yields, as a rule, leads to a decrease in the value of the dollar. Thus, the world's most popular 10-year US Treasuries are currently trading at a rate of 4.239%, while on March 18, a peak yield of 4.310% was recorded. During the same period, the USDX quotes rose from 102.7 points to the current 104.0 points. The 30-year bonds are trading at a rate of 4,400%, whereas on March 18 their yield was 4.447%, and the decrease was only -0.9%, while the increase in the dollar index over this period was 1.3%. Thus, most likely, the USDX will continue a smooth lateral movement with a slight upward emphasis.
In addition to the underlying fundamental factors, technical indicators also signal a possible continuation of corrective growth in the near future: on the W1 chart, the price has long been in the process of forming a global "diamond" pattern, the implementation of which may begin as early as this month.
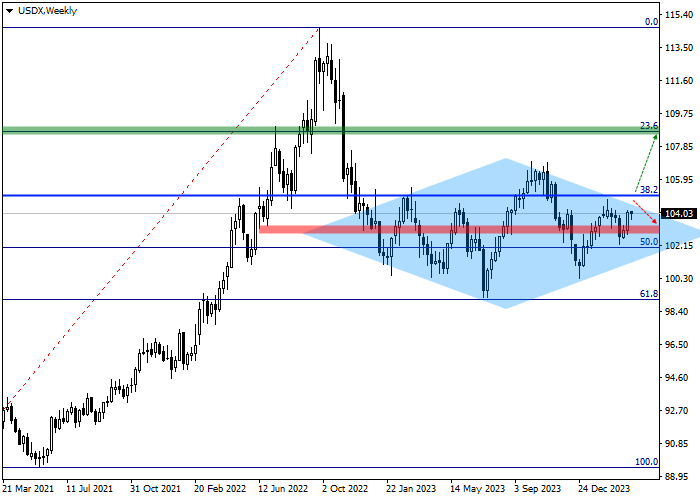
The main factors indicate a high probability of continuing the formation of this upward wave and the price overcoming the resistance line of the pattern, as well as the level of the basic 38.2% Fibonacci retracement at 105.00.
Key levels can be seen on the D1 chart.
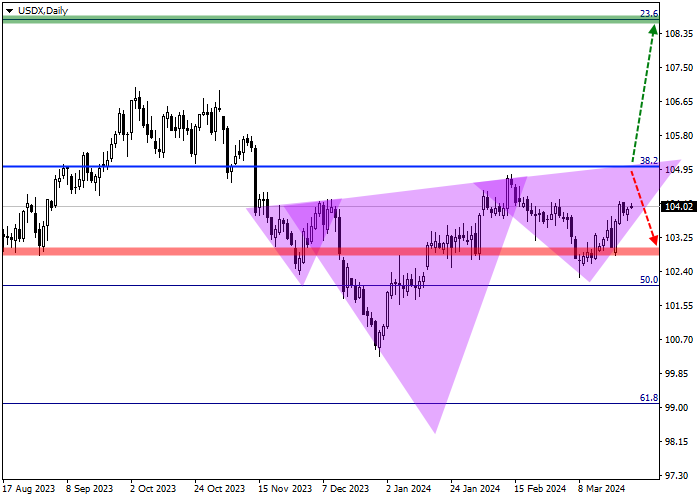
As can be seen on the chart, the upward wave within the framework of the "head and shoulders" reversal pattern has almost completed the formation of the second "shoulder", and the "neck" line of the pattern coincides with the level of the basic 38.2% Fibonacci retracement at 105.00, which only increases the likelihood of further growth.
Near the local support level at around 102.80, there is a zone of cancellation of the buy signal. In case of a price reversal and continued decline after reaching this level, the upward scenario will either be canceled or significantly delayed in time, and open positions should be liquidated.
In the area of the 108.70 mark, which is at the level of the initial 23.6% Fibonacci retracement, there is a target zone; if it is reached, profit should be fixed on open buy positions.
In more detail, trade entry levels can be evaluated on the H4 chart.
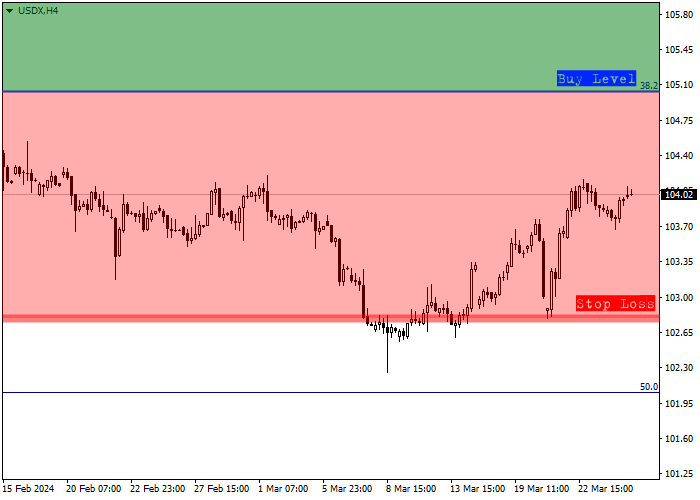
The entry level for buy transactions is located at 105.00, which coincides with the level of the basic 38.2% Fibonacci retracement, and a local signal can be received as early as this week. Technically, a breakdown of the local maximum of the current wave inside the "head and shoulders" pattern will be implemented, after which there will be no significant resistance on the way of the price to the target level of 108.70, and the position can be implemented.
Given the average daily volatility of the trading instrument over the past month, which is 34.0 points, the price movement to the target zone of 105.00 may take about 38 trading sessions, however, with increasing volatility, this time may be reduced to 30 trading days.
Disclaimer: The content above represents only the views of the author or guest. It does not represent any views or positions of FOLLOWME and does not mean that FOLLOWME agrees with its statement or description, nor does it constitute any investment advice. For all actions taken by visitors based on information provided by the FOLLOWME community, the community does not assume any form of liability unless otherwise expressly promised in writing.
FOLLOWME Trading Community Website: https://www.followme.com


Hot
No comment on record. Start new comment.