Current trend
The leading US economy index S&P 500 is correcting around 5232.0. The corporate reporting season starts in a month, and now macroeconomic reports and the situation on the bond market are coming to the fore.
The volume of orders for durable goods in the United States increased by 1.4% in February, after -6.9% a month earlier, and the base indicator added 0.5% after -0.3%. In turn, housing prices decreased slightly by 0.1% after an increase of 0.1%, and in annual terms, the dynamics slowed to 6.3% from 6.7%. In addition, one can note a slight decrease in the Conference Board consumer confidence index in March to 104.7 points from 104.8 points.
The bond market has seen another local turn towards growth, which was the main reason for the pullback of quotes: 10-year securities are trading at a rate of 4.239%, exceeding last week's highs at 4.194%, the yield of 20-year bonds is 4.501% after 4.449% recorded a week earlier, and 30-year bonds have increased to 4.400% from 4.365%.
The growth leaders in the index are McCormick & Company Inc. ( 10.52%), Seagate Technology Plc. ( 7.38%), Western Digital Corp. ( 4.88%), MGM Resorts International ( 4.29%).
Among the leaders of the decline are United Parcel Service Inc. (-8.16%), International Paper Co. (-6.49%), APA Corp. (-4.94%).
Support and resistance
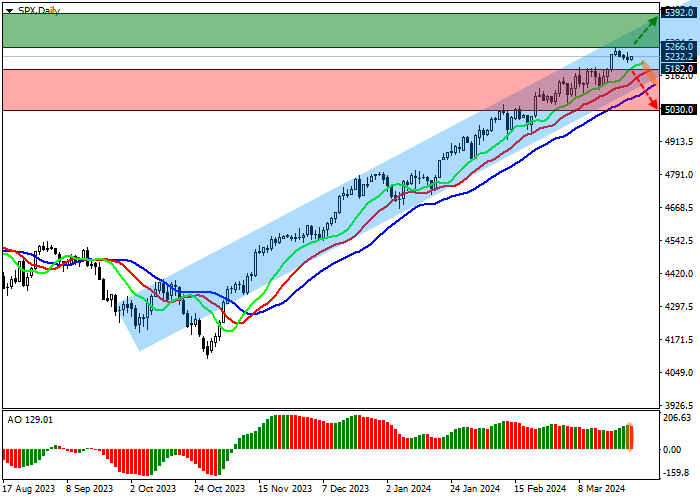
The index quotes continue to grow and move in the direction of the resistance line of the ascending channel with the borders of 5400.0–5150.0 on the D1 chart.
Technical indicators hold the buy signal, which is still quite stable: the fast EMAs on the Alligator indicator are moving away from the signal line, and the AO histogram, being in the buy zone, forms ascending bars.
Support levels: 5182.0, 5030.0.
Resistance levels: 5266.0, 5392.0.
Trading tips
In case of continued growth of the asset, as well as price consolidation above the resistance level of 5266.0, buy positions with the target of 5392.0 may be opened. Stop-loss – 5200.0. Implementation time: 7 days and more.
In the event of a reversal and decline of the asset, as well as price consolidation below the support level of 5182.0, sell positions with the target of 5030.0 can be opened. Stop-loss – 5250.0.


Hot
No comment on record. Start new comment.