Current trend
The AUD/USD pair shows mixed trading, located near 0.6540: the instrument ended Monday's session with a fairly noticeable increase, mainly due to technical factors.
Data published yesterday in the United States put little pressure on the position of the American currency: New Home Sales in February decreased by 0.3% after an increase of 1.7% in the previous month, and New Home Sales Change decreased from 0.664 million to 0.662 million, while analysts expected 0.680 million. Dallas Fed Manufacturing Business Index in March fell from -11.3 points to -14.4 points. Today, investors' attention is focused on statistics on Durable Goods Orders, which the US Federal Reserve actively uses in its calculations. In February, investors expect moderate growth of 1.3% after -6.2% in the previous month. If the index increase is higher than expected, sentiment regarding the expected decline in borrowing costs in June could change again.
In turn, pressure on the position of the instrument is exerted by data on consumer confidence presented today in Australia: in March, Westpac Consumer Confidence decreased by 1.8% after increasing by 6.2% a month earlier. Tomorrow, investors will pay attention to the final assessment of CPI dynamics in Australia in February: forecasts suggest a slight increase in the indicator from 3.4% to 3.5%.
The Reserve Bank of Australia's (RBA) half-year report, released on Friday, said that while high inflation and interest rates have put pressure on household budgets over the past two years, almost all borrowers continue to service debt on schedule. Costs for such servicing have increased by approximately 30.0-60.0% since the regulator began raising interest rates in May 2022. One in 20 mortgage holders in Australia spend more than they earn, but officials say less than 1.0% of all home loans were 90 days or more in arrears. The report also highlights that a strong labor market has supported the country's ability to finance debt obligations: in February, the Unemployment Rate dropped to 3.7% from 4.1% previously, while a record 117.0 thousand additional jobs were created.
Support and resistance
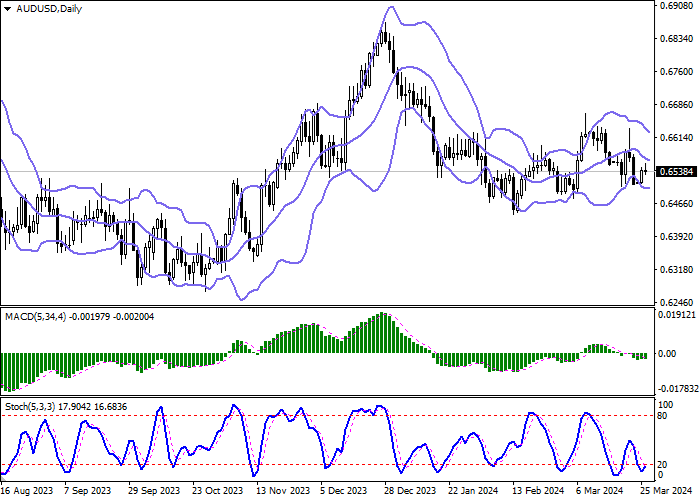
Bollinger Bands in D1 chart demonstrate a moderate decrease. The price range is slightly narrowed from below, remaining spacious enough for the current market activity. MACD indicator tries to reverse to growth and to form a new buy signal (the histogram is about to consolidate above the signal line). Stochastic, located near its lows, demonstrates similar dynamics, signaling in favor of the further development of corrective sentiment.
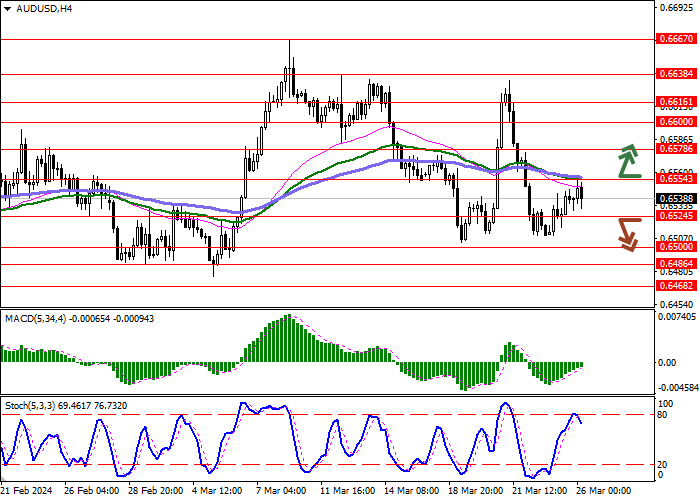
Resistance levels: 0.6554, 0.6578, 0.6600, 0.6616.
Support levels: 0.6524, 0.6500, 0.6486, 0.6468.
Trading tips
Long positions can be opened after a breakout of 0.6554 with the target of 0.6600. Stop-loss — 0.6530. Implementation time: 2-3 days.
The return of a "bearish" trend with the breakdown of 0.6524 may become a signal for new short positions with the target at 0.6486. Stop-loss — 0.6545.


Hot
No comment on record. Start new comment.