Current trend
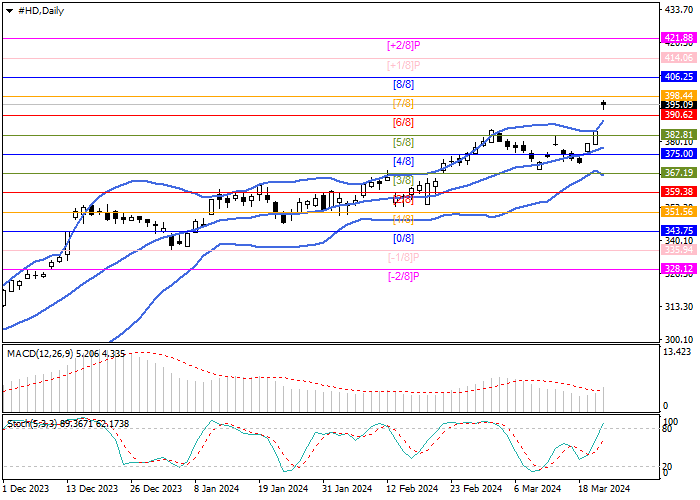
Shares of The Home Depot Inc., a major home improvement company, have been growing for the fifth month, with the price now moving into the positive portion of Murrey’s trading range and holding above the 390.62 pivot point (Murrey’s [6/8] level), which will allow it to reach the upper line of the trading range 406.25 (Murrey level [8/8]) and then the pivot level of 421.88 (Murrey level [ 2/8]). In case of consolidation below the key “bearish” level 375.00 (Murrey level [4/8]), supported by the middle line of Bollinger bands, a decline to the area of 359.38 (Murrey level [2/8]), 343.75 (Murrey level [0/8]) is expected.
Technical indicators reflect the continuation of the upward trend: Bollinger Bands and Stochastic reverse upwards, and the MACD histogram is increasing in the positive zone. The price chart decrease beyond the upper Bollinger band does not exclude a correction to 382.81 (Murrey level [5/8]) but is unlikely to lead to a trend reversal.
Support and resistance
Resistance levels: 406.25, 421.88.
Support levels: 375.00, 359.38, 343.75.

Trading tips
Long positions may be opened from 398.00 or after a reversal at 382.81, with the targets at 406.25 and 421.88. Stop losses are 392.80 and 368.00, respectively. Implementation time: 5–7 days.


Hot
No comment on record. Start new comment.