Current trend
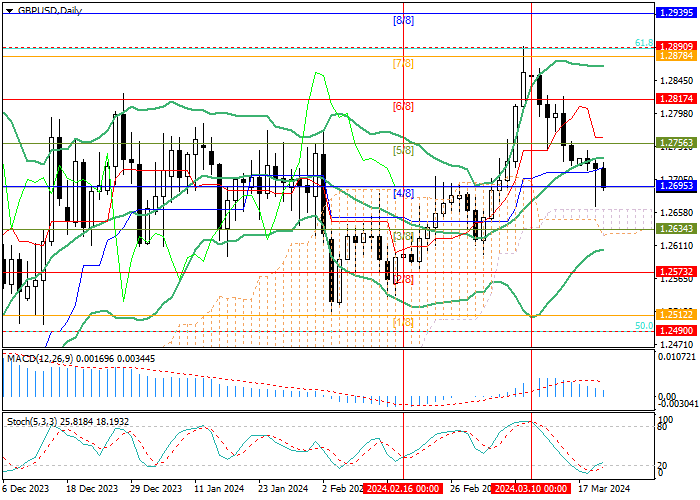
The GBP/USD pair has been steadily declining for the second week in a row and has now consolidated below the central line of Bollinger Bands, testing the 1.2695 mark (Murrey level [4/8]).
Today, the pound is under pressure from the publication of February inflation data: YoY, the indicator fell from 4.0% to 3.4% with forecasts of 3.5%, and the base indicator – from 5.1% to 4.5% with preliminary estimates of 4.6%. Thus, the growth rate of consumer prices is slowing down significantly than experts expected, while the labor market is showing clear signs of cooling, forming more and more grounds for the Bank of England to start lowering interest rates soon. Most market participants expect officials to take this step in June, but current economic conditions increase the likelihood of a monetary policy correction in May – earlier than the US Federal Reserve and the European Central Bank (ECB) are projected to do. This prospect puts pressure on the British currency, strengthening the position of its competitors.
At 20:00 (GMT 2), the results of the two-day meeting of the US Federal Reserve will be monitored: most experts believe that the US regulator will maintain the same rhetoric, confirming significant progress in the fight against rising consumer prices and declaring its intention to wait some more time before starting to reduce the cost of borrowing. Nevertheless, officials may hint at the possibility of shifting the timing of the interest rate adjustment to the second half of the year due to a sharp inflationary jump in February. In this case, the downtrend of GBP/USD will be able to continue.
Support and resistance
The instrument is testing the 1.2695 mark (Murrey level [4/8]), consolidating below which will allow quotes to continue to decline to the levels of 1.2634 (Murrey level [3/8]) and 1.2573 (Murrey level [2/8]). If the price reverses and consolidates above the central line of Bollinger Bands and the level of 1.2756 (Murrey level [5/8]), growth may resume towards the targets of 1.2817 (Murrey level [6/8]), 1.2890 (61.8% Fibonacci retracement), and 1.2939 (Murrey level [8/8]).
Technical indicators do not give a clear signal: Bollinger Bands start horizontal movement after growth, MACD is decreasing in the positive zone, but Stochastic is reversing up.
Resistance levels: 1.2756, 1.2817, 1.2890, 1.2939.
Support levels: 1.2695, 1.2634, 1.2573.
Trading tips
Short positions should be opened below the level of 1.2695 with targets of 1.2634, 1.2573 and stop-loss around 1.2740. Implementation period: 5–7 days.
Long positions can be opened above 1.2756 with targets of 1.2817, 1.2890, 1.2939 and stop-loss around 1.2710.


Hot
No comment on record. Start new comment.