Current trend
The leading index of the American economy, the S&P 500, is correcting at around 5140.0 against the backdrop of macroeconomic reports and the situation on the bond market.
The US Export Price Index added 0.8% in February after rising 0.9% a month earlier, while the Import Price Index rose 0.3%, below the 0.8% recorded in January. In annual terms, Export prices slowed down their fall to -1.8% from -2.2%, and Import prices to -0.8% from -1.3%. In addition, Industrial Production adjusted by 0.1% after -0.5% in monthly terms and by -0.23% after -0.31% in annual terms.
The bond market has seen another reversal towards growth, which does not allow the index to update annual highs: 10-year bonds are trading at a rate of 4.304%, which exceeds last week’s high of 4.224%, and the yield on 20-year bonds is 4.548%, increasing with 4.446%.
The growth leaders in the index are CoStar Group Inc. ( 8.32%), Steel Dynamics Inc. ( 4.34%), Cummins Inc. ( 4.23%), Nucor Corp. ( 3.51%).
Among the leaders of the decline are Jabil Circuit Inc. (-16.42%), Adobe Systems Inc. (-13.67%), Ulta Beauty Inc. (-5.21%).
Support and resistance
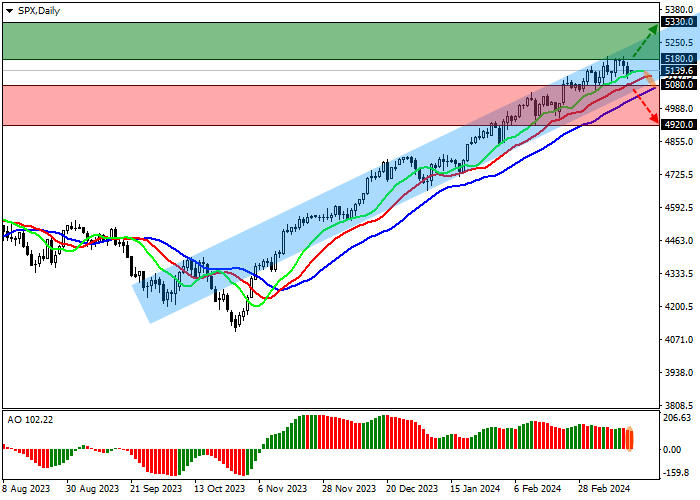
Index quotes continue to grow, moving in the direction of the resistance line of the ascending channel with boundaries of 5300.0–5000.0 on the daily chart.
Technical indicators maintain a fairly strong buy signal: fast EMAs on the Alligator indicator are moving away from the signal line, and the AO histogram, being in the buy zone, is forming ascending bars.
Support levels: 5080.0, 4920.0.
Resistance levels: 5180.0, 5330.0.
Trading tips
If the asset continues growing locally and the price consolidates above the local resistance level of 5180.0, long positions will be relevant with target at 5330.0. Stop-loss — 5100.0. Implementation time: 7 days and more.
If the asset reverses and declines and the price consolidates below local support at 5080.0, short positions can be opened with the target at 4920.0. Stop-loss — 5150.0.


Hot
No comment on record. Start new comment.