Current trend
During the Asian session, the AUD/USD pair is trading around 0.6565, retreating from the lows of March 6, renewed at the end of last week: traders are in no hurry to open positions until new key data appears.
Thus, investors are awaiting the results of the US Federal Reserve meeting on interest rates. According to preliminary estimates, the regulator will not change the current monetary policy parameters but will present renewed forecasts. The market is pricing in three 25-basis point interest rate cuts this year, with the first not coming until June. The American dollar is under pressure from Friday’s macroeconomic statistics: the consumer confidence index from the University of Michigan in March fell from 76.9 points to 76.5 points, worse than analysts’ neutral forecasts, and the Federal Reserve Bank of New York manufacturing PMI – from –2.4 points to –20.9 points relative to calculations of –7.0 points.
On Tuesday at 5:30 (GMT 2), the results of the Reserve Bank of Australia (RBA) meeting will be published. According to a survey of leading economists on the regulator’s future actions conducted by Reuters, the majority believe that officials will leave the interest rate at 4.35% and keep it at this level until at least September or November, after which two reductions in borrowing costs may follow. On Thursday, investors will pay attention to the report on the employment level in the country: in February, the indicator may adjust from 0.5K to 40.0K, and the unemployment rate – from 4.1% to 4.0%.
Support and resistance
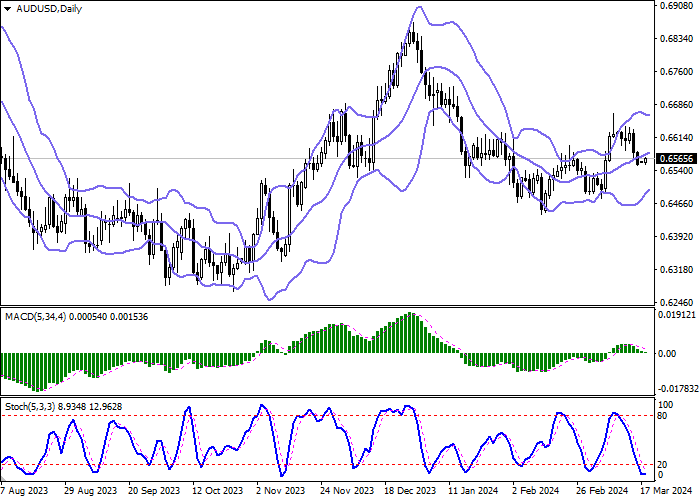
On the daily chart, Bollinger Bands are rising moderately as the price range narrows, reflecting ambiguous trading in the short term. The MACD indicator is declining, maintaining a sell signal: the histogram is below the signal line, trying to consolidate below the zero level. Stochastic reached its lows and reversed horizontally, indicating that the Australian dollar may become oversold in the ultra-short term.
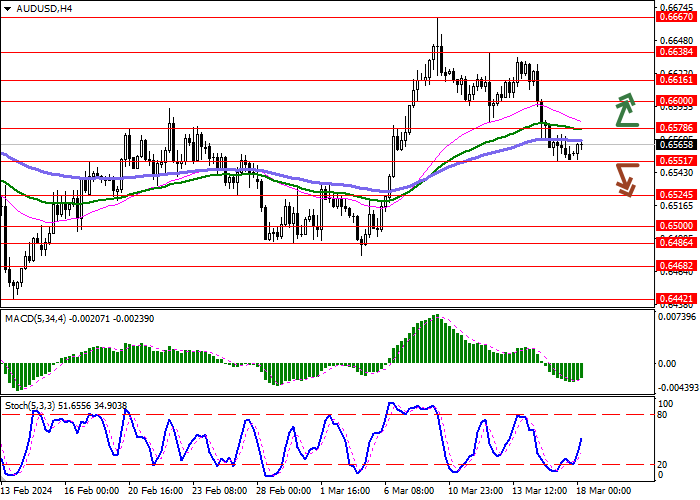
Resistance levels: 0.6578, 0.6600, 0.6616, 0.6638.
Support levels: 0.6551, 0.6524, 0.6500, 0.6486.
Trading tips
Short positions may be opened after a breakdown of 0.6551, with the target at 0.6500. Stop loss – 0.6578. Implementation time: 2–3 days.
Long positions may be opened after a breakout of 0.6578, with the target at 0.6616. Stop loss – 0.6551.


Hot
No comment on record. Start new comment.