Current trend
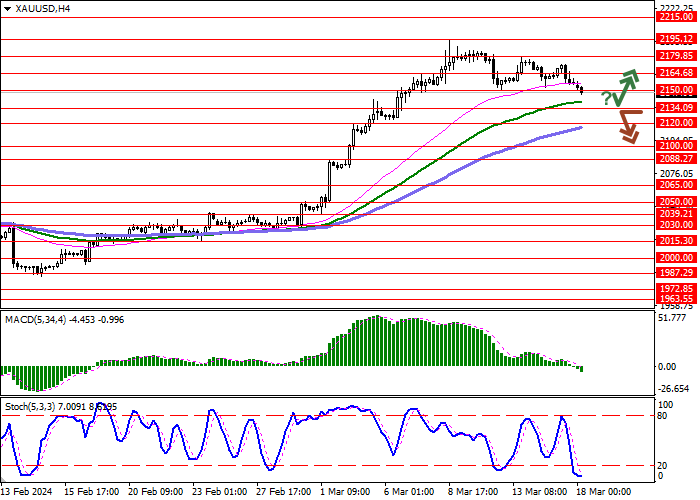
The XAU/USD pair is developing the "bearish" momentum formed last week: the instrument is testing 2145.00 for a breakdown, updating the local lows of March 7.
Quotes are being pressured by the upcoming meetings of global central banks this week, from which they are not expected to take steps towards easing monetary conditions. Moreover, the Bank of Japan could announce a historic rise in borrowing costs tomorrow, ending an eight-year period of negative interest rates during which it battled the effects of deflation. In turn, the US Federal Reserve and the Bank of England are unlikely to change the parameters of monetary policy, but analysts fear that both regulators will signal in favor of a more balanced approach before switching to "dovish" rhetoric. However, forecasts still suggest that the American regulator will lower interest rates at least three times before the end of 2024.
Trading participants continue to evaluate macroeconomic statistics from the United States, published last Friday. The Consumer Confidence Index from the University of Michigan dropped from 76.9 points to 76.5 points in March, while analysts expected it to remain the same. Industrial Production volumes in February added 0.1% after -0.5% in the previous month, while experts expected zero dynamics, and Capacity Utilization remained at 78.3% against the forecast of 78.5%.
The correction in the gold contract market continues. According to the report of the US Commodity Futures Trading Commission (CFTC), last week the number of net speculative positions in precious metal increased to 201.6 thousand from 191.3 thousand a week earlier. The balance in positions secured by real money amounted to 190.374 thousand for the "bulls" versus 30.814 thousand for the "bears". Last week, buyers increased the number of contracts by 25.734 thousand, and sellers decreased it by 2.766 thousand, provoking new investors to continue buying.
Support and resistance
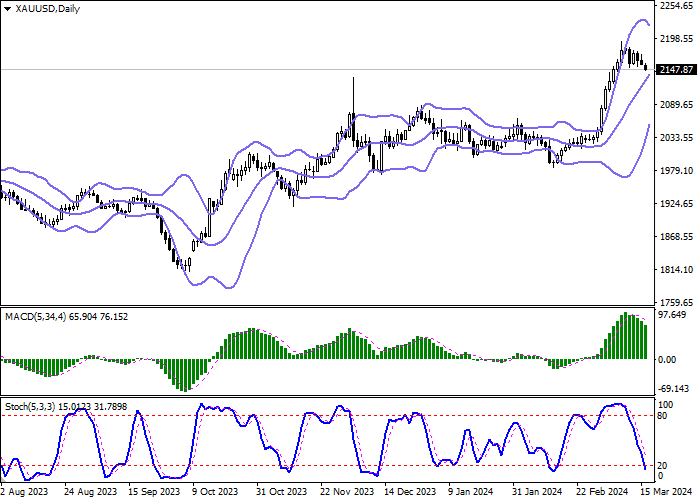
Bollinger Bands on the daily chart show a steady increase. The price range is narrowing, reflecting the emergence of ambiguous dynamics of trading in the short term. MACD is going down preserving a stable sell signal (located below the signal line). Stochastic shows similar dynamics; however, the indicator line is located close to its lows, indicating the risks of gold being oversold in the ultra-short term.
Resistance levels: 2164.68, 2179.85, 2195.12, 2215.00.
Support levels: 2150.00, 2134.09, 2120.00, 2100.00.
Trading tips
Short positions may be opened after a breakdown of 2134.09 with the target at 2100.00. Stop-loss — 2150.00. Implementation time: 2-3 days.
A rebound from 2134.09 as from support followed by a breakout of 2150.00 may become a signal for opening new long positions with the target at 2179.85. Stop-loss — 2134.09.


Hot
No comment on record. Start new comment.