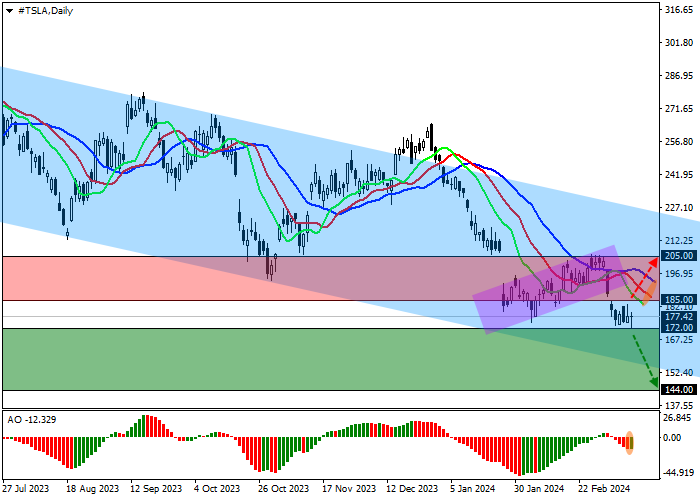
Shares of Tesla Inc., a leading manufacturer of electric cars, continue their global correction, trading at 177.00.
On the daily chart, the price is held within the downward channel 227.00–157.00, heading towards the support line.
On the four-hour chart, the consolidation below the previous local low of 180.00 and the beginning of a global Flag trend continuation pattern with an implementation level of 185.00 confirm the decline in the quotes.
Technical indicators are strengthening the sell signal: fast EMAs on the Alligator indicator are moving away from the signal line, and the AO histogram is forming downward bars in the sell zone.
Trading tips
Short positions may be opened after the price declines and consolidates below 172.00, with the target at 144.00. Stop loss – 185.00. Implementation period: 7 days or more.
Long positions may be opened after the price rises and consolidates above 185.00, with the target at 205.00. Stop loss – 179.00.
Disclaimer: The content above represents only the views of the author or guest. It does not represent any views or positions of FOLLOWME and does not mean that FOLLOWME agrees with its statement or description, nor does it constitute any investment advice. For all actions taken by visitors based on information provided by the FOLLOWME community, the community does not assume any form of liability unless otherwise expressly promised in writing.


Hot
No comment on record. Start new comment.