Current trend
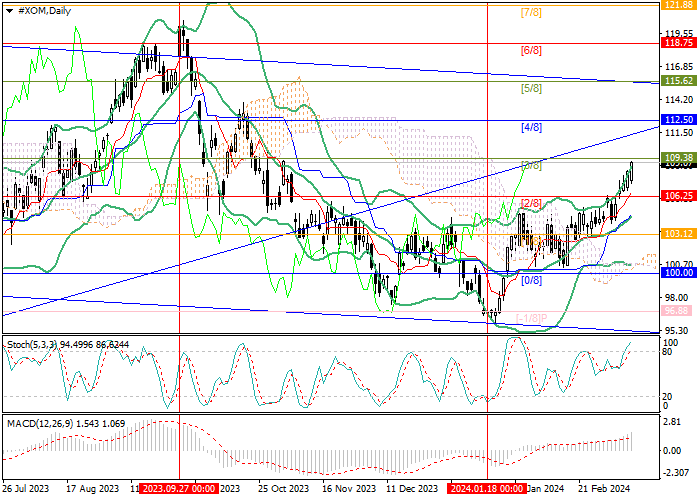
Shares of ExxonMobil Corp., an American oil company, in mid-January reached the lower limit of the long-term downward channel in the area of 96.88 (Murrey level [-1/8]), after which they began a corrective growth and are currently close to 109.38 (Murrey level [3/8]), the breakdown of which will allow quotes to develop upward dynamics to the targets of 112.50 (Murrey level [4/8]) and 115.62 (Murrey level [5/8], the upper border of the descending channel).
The key for the "bears" is the level of 103.12 (Murrey level [1/8]) below the central line of Bollinger Bands; after consolidation below it the trading instrument can resume its decline to 100.00 (Murrey level [0/8]) and 96.88 (Murrey level [-1/8]), but such a scenario is less likely.
Technical indicators confirm the continuation of the uptrend: Bollinger Bands and Stochastic are directed upwards, MACD is growing in the positive zone.
Support and resistance
Resistance levels: 109.38, 112.50, 115.62.
Support levels: 103.12, 100.00, 96.88.

Trading tips
Long positions can be opened above 109.38 with targets of 112.50, 115.62 and stop-loss around 107.30. Implementation period: 5–7 days.
Short positions should be opened below the level of 103.12 with targets of 100.00, 96.88 and stop-loss around 105.20.


Hot
No comment on record. Start new comment.