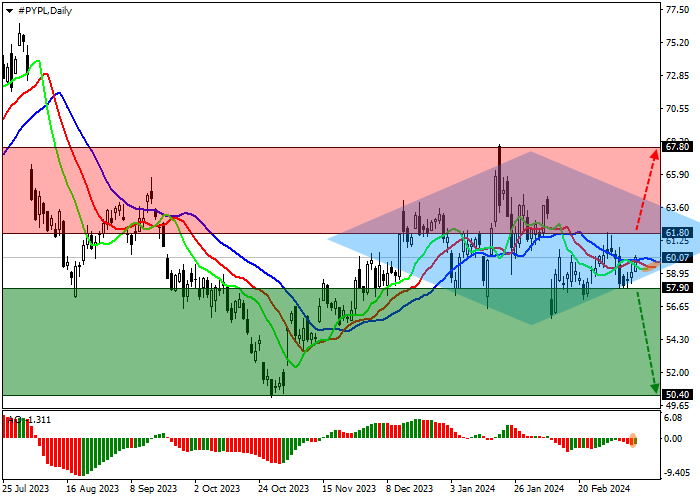
Shares of PayPal Holdings Inc., an American debit payment system, are corrected at 60.00.
On the daily chart, the price is unsuccessfully trying to consolidate below the support line of the Diamond reversal pattern with dynamic boundaries of 64.00–58.00.
On the four-hour chart, the quotes retested 58.00: within the formation, positive dynamics can reach 63.00, after which the asset will reverse downwards again. As the pattern continues to narrow, one of the boundaries will be broken very soon and a downside exit is more likely.
Technical indicators maintain a poor sell signal: fast EMAs on the Alligator indicator are below the signal line, and the AO histogram forms corrective bars in the sell zone.
Trading tips
Short positions may be opened after the price declines and consolidates below 57.90 with the target at 50.40. Stop loss – 60.00. Implementation period: 7 days or more.
Long positions may be opened after the price rises and consolidates above 61.80 with the target at 67.80. Stop loss – 60.00.
Disclaimer: The content above represents only the views of the author or guest. It does not represent any views or positions of FOLLOWME and does not mean that FOLLOWME agrees with its statement or description, nor does it constitute any investment advice. For all actions taken by visitors based on information provided by the FOLLOWME community, the community does not assume any form of liability unless otherwise expressly promised in writing.


Hot
No comment on record. Start new comment.