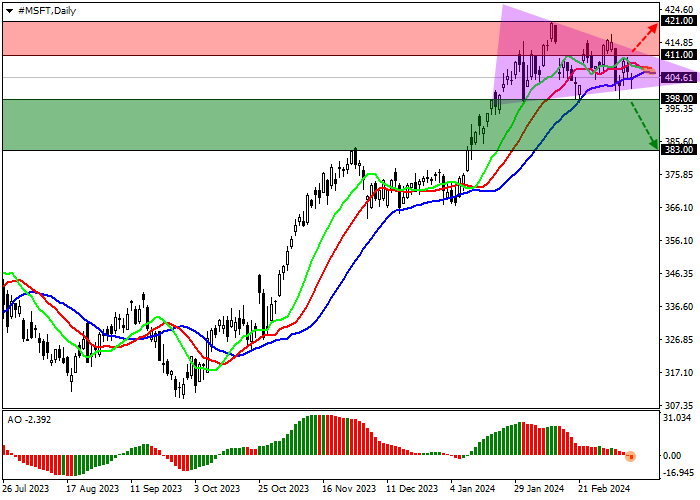
Shares of Microsoft Corp., a giant in the development and sale of operating systems and software for computers, are trading in a corrective trend at 404.00.
On the daily chart, the price is holding near the yearly high from January 29, 420.00, preparing for a reversal.
On the four-hour chart, the quotes are forming a downward correction within the local Triangle pattern with boundaries of 415.00–400.00, and after crossing the support line of 400.00, the dynamics may intensify.
Technical indicators are holding a poor buy signal: the EMA fluctuation range on the “Alligator” indicator is actively narrowing down, and the AO histogram is forming corrective bars below the transition level.
Trading tips
Short positions may be opened after the price declines and consolidates below 398.00 with the target at 383.00. Stop loss – 408.00. Implementation period: 7 days or more.
Long positions may be opened after the price rises and consolidates above 411.00 with the target at 421.00. Stop loss – 405.00.
Disclaimer: The content above represents only the views of the author or guest. It does not represent any views or positions of FOLLOWME and does not mean that FOLLOWME agrees with its statement or description, nor does it constitute any investment advice. For all actions taken by visitors based on information provided by the FOLLOWME community, the community does not assume any form of liability unless otherwise expressly promised in writing.


Hot
No comment on record. Start new comment.