Current trend
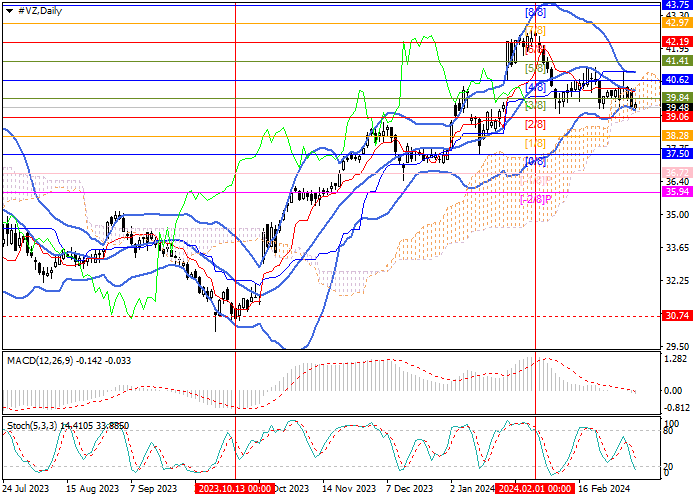
Shares of Verizon Communications Inc., one of the largest American telecommunications companies, started a downward correction at the beginning of last month after a long rise: the price reversed downwards from 42.19 (Murrey level [6/8]), entered the negative part of Murrey’s trading range and is now close to the lower reversal mark 39.06 (Murrey level [2/8]). After its breakdown, it is possible to move to the lower border of the trading range 37.50 (Murrey level [0/8]) and further into the reversal zone to 35.94 (Murrey level [–2/8]). After a breakout of the key “bullish” level of 40.62 (Murrey level [4/8]) above the middle line of Bollinger bands, growth to 42.19 (Murrey level [6/8]) and 43.75 (Murrey level [8/8]) is expected.
Technical indicators suggest the possibility of continued negative dynamics: Bollinger Bands and Stochastic are directed downwards, and the MACD histogram has entered the negative zone.
Support and resistance
Resistance levels: 40.62, 42.19, 43.75.
Support levels: 39.06, 37.50, 35.94.

Trading tips
Short positions may be opened below 39.06 with the targets at 37.50, 35.94 and stop loss 40.15. Implementation time: 5–7 days.
Long positions may be opened above 40.62 with the targets at 42.19, 43.75 and stop loss 39.50.


Hot
No comment on record. Start new comment.