Current trend
Ahead of the publication of macroeconomic statistics in the US, the USD/CAD pair remains near 1.3480.
Tomorrow at 14:30 (GMT 2) updated February inflation data will be presented: forecasts suggest that the Consumer Price Index will add 0.4% monthly and 3.1% annualized, with previous estimates of 0.3% and 3.1%, respectively, and the CPI excluding Food and Energy may be adjusted from 3.9% to 3.7%.
Investors evaluate Friday's publications on the US and Canadian labor markets. The American Average Hourly Earnings in February decreased from 0.5% to 0.1%, with expectations of 0.3%, and in annual terms, earnings growth slowed down from 4.4% to 4.3%, while the Unemployment Rate rose from 3.7% to 3.9%, and Nonfarm Payrolls increased by 275.0 thousand, with a forecast of 200.0 thousand. In turn, the Canadian report reflected an increase in the Net Change in Employment in February by 40.7 thousand after an increase of 37.3 thousand in the previous month, while analysts expected 20.0 thousand, the Average Hourly Earnings slowed down from 5.3% to 4.9%, and the Unemployment Rate adjusted from 5.7% to 5.8%.
Support and resistance
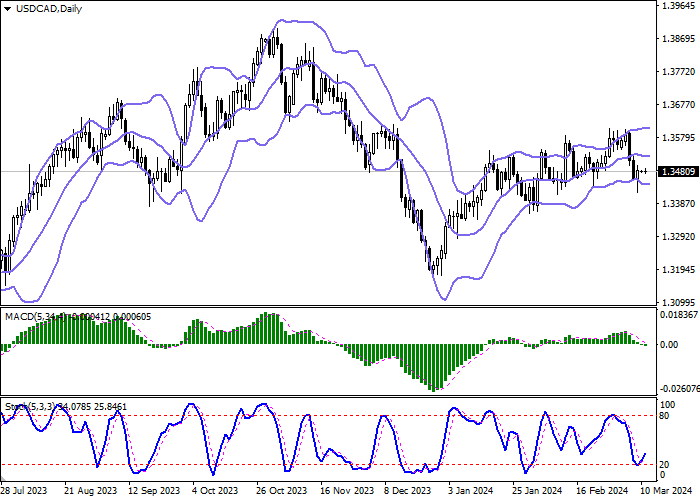
Bollinger Bands in D1 chart demonstrate flat dynamics. The price range is almost unchanged, but it remains rather spacious for the current level of activity in the market. MACD is falling, keeping a relatively strong sell signal (the histogram is below the signal line). The indicator is trying to consolidate below the zero level. Stochastic, having rebounded from the level of "20", reversed into the ascending plane, signaling in favor of a possible development of corrective growth in the near future.
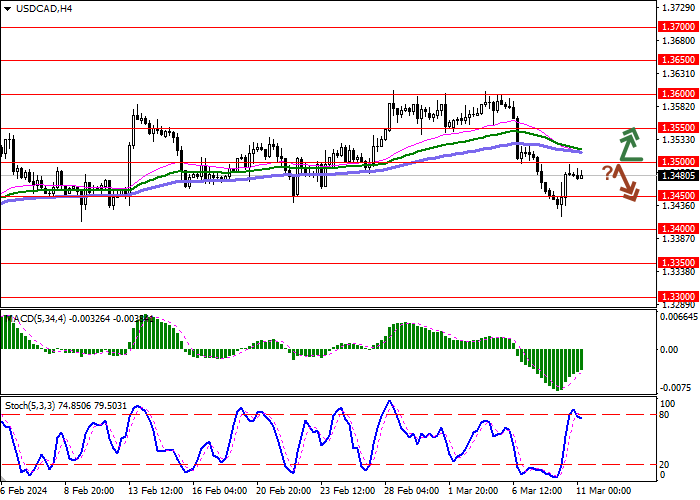
Resistance levels: 1.3500, 1.3550, 1.3600, 1.3650.
Support levels: 1.3450, 1.3400, 1.3350, 1.3300.

Trading tips
Long positions can be opened after a breakout of 1.3500 with the target of 1.3600. Stop-loss — 1.3450. Implementation time: 2-3 days.
A rebound from 1.3500 as from resistance, followed by a breakdown of 1.3450 may become a signal for opening of new short positions with the target at 1.3350. Stop-loss — 1.3500.


Hot
No comment on record. Start new comment.