Current trend
The leading index of the London Stock Exchange FTSE 100 is trading at 7652.0, continuing to correct in a global sideways trend against the backdrop of unstable reporting from component companies.
Today, financial results will be published by insurance company Aviva Plc., as well as Admiral Group Plc., which provides financial services. Analysts expect Aviva Plc. will record revenue of 22.54 billion pounds after 8.998 billion pounds in the previous quarter, and earnings per share are expected at 21.30 pounds, up from 19.90 pounds previously shown. In turn, the income of Admiral Group Plc. is forecast at 1.87 billion pounds, down from 2.02 billion pounds in the previous quarter, and earnings per share could rise to 59.59 pounds from 57.60 pounds.
The global sideways performance of the index is supported by the situation in the domestic bond market, where recent growth has given way to local decline: 10-year bonds are trading at a rate of 4.033%, down from 4.156% shown last week, and the 20-year bonds yield is holding at 4.450%, down from a peak value of 4.630%.
The growth leaders in the index are ConvaTec Group Plc. ( 6.10%), International Airlines Group SA ( 4.79%), Anglo American Plc. ( 3.73%), Smith & Nephew Plc. ( 2.72%).
Among the leaders of the decline are Hikma Pharmaceuticals Plc. (-3.03%), Fresnillo Plc. (-2.92%), Smurfit Kappa Group Plc. (-2.52%).
Support and resistance
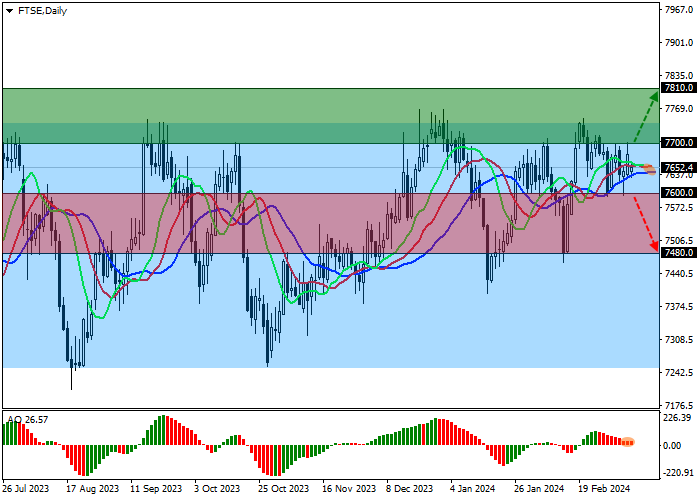
On the daily chart, the index quotes continue their local correction, rising in the direction of the resistance line of the global side channel with boundaries of 7750.0–7250.0.
Technical indicators are in a buy signal state, which remains stable even against the backdrop of a correction: the range of EMA fluctuations on the Alligator indicator is directed upwards and the AO histogram is forming new corrective bars, being in the buy area.
Support levels: 7600.0, 7480.0.
Resistance levels: 7700.0, 7810.0.
Trading tips
If the index continues growing, and the price consolidates above the local resistance at 7700.0, long positions with a target of 7810.0 and stop-loss of 7650.0 will be relevant. Implementation time: 7 days and more.
If the asset continues declining and the price consolidates below 7600.0, short positions can be opened with the target at 7480.0. Stop-loss — 7650.0.


Hot
No comment on record. Start new comment.