Current trend
The leading US economy index S&P 500 is correcting at around 5137.0. The period for publishing corporate reports of component companies is ending, shifting the focus of investors' attention to the dynamics in the bond market.
Today, traders will pay attention to the financial results of the department store chain Ross Stores Inc., whose revenue could reach 5.8 billion dollars, significantly exceeding 4.9 billion dollars previously. Earnings per share are also expected to rise to 1.65 dollars from 1.33 dollars.
In turn, the Chinese commercial giant JD.com Inc. could show a significant increase in revenue to 299.7 billion yuan from 247.7 billion yuan in the previous quarter, and earnings per share are projected at 4.51 yuan, down from 6.70 yuan recorded in the previous period.
The US bond market has seen a downward turn, supporting the index's gains, with the 10-year note trading at 4.195%, down from last week's high of 4.291%, and the 20-year yield falling to 4.465% from 4.576%.
The growth leaders in the index are NetApp Inc. ( 18.17%), Cooper Companies Inc. ( 9.18%), Western Digital Corp. ( 8.12%), Broadcom Inc. ( 7.59%).
Among the leaders of the decline are Dominion Energy Inc. (-6.36%), Las Vegas Sands Corp. (-5.94%), Xcel Energy Inc. (-5.92%).
Support and resistance
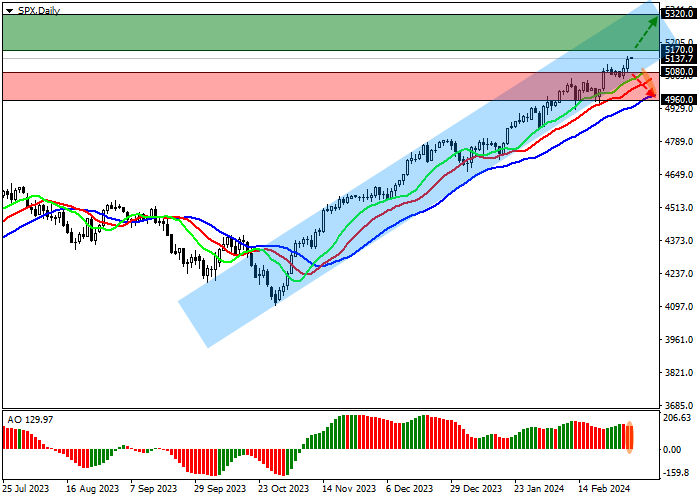
Index quotes continue to grow globally and move in the direction of the resistance line of the ascending channel with boundaries of 5300.0–5000.0.
Technical indicators hold a global buy signal, which strengthens: fast EMAs on the Alligator indicator are moving away from the signal line, and the AO histogram, being in the buy zone, is forming ascending bars.
Support levels: 5080.0, 4960.0.
Resistance levels: 5170.0, 5320.0.

Trading tips
If the asset continues to grow and consolidates above the resistance level of 5170.0, buy positions with a target of 5320.0 will be relevant. Stop-loss — 5100.0. Implementation time: 7 days and more.
If the asset reverses and declines and the price consolidates below 5080.0, short positions can be opened with the target at 4960.0. Stop-loss — 5150.0.


Hot
No comment on record. Start new comment.