PFIZER INC.: ANALISIS TEKNIS


| Skenario | |
|---|---|
| Jangka waktu | Weekly |
| Rekomendasi | SELL STOP |
| Titik masuk | 26.10 |
| Take Profit | 23.50 |
| Stop Loss | 27.00 |
| Tingkat kunci | 23.00, 23.50, 26.00, 26.40, 26.80, 27.00, 28.00, 30.00 |
| Skenario alternatif | |
|---|---|
| Rekomendasi | BUY STOP |
| Titik masuk | 27.80 |
| Take Profit | 30.00 |
| Stop Loss | 27.00 |
| Tingkat kunci | 23.00, 23.50, 26.00, 26.40, 26.80, 27.00, 28.00, 30.00 |
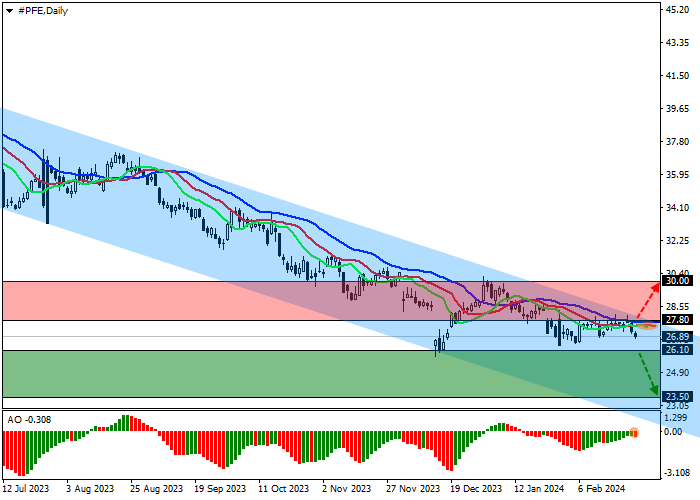
Saham Pfizer Inc., perusahaan farmasi terbesar Amerika, terkoreksi pada 27.00.
Pada grafik harian, harga bergerak dalam channel turun global dengan batas dinamis 28.00–23.00, setelah gagal menguji garis resistance kemarin.
Pada grafik empat jam, harga berbalik dan siap untuk berkonsolidasi di bawah titik terendah terdekat di 26.80, setelah itu target berikutnya adalah harga terendah pada 5 Februari di 26.40 dan terendah tahun lalu di 26.00.
Indikator teknikal telah mengeluarkan sinyal jual: fast EMA pada indikator Alligator berada di bawah garis sinyal, dan histogram AO membentuk bar ke bawah di bawah level transisi.
Tips perdagangan
Posisi sell dapat dibuka setelah harga turun dan berkonsolidasi di bawah 26.10, dengan target di 23.50. Stop loss – 27.00. Periode implementasi: 7 hari atau lebih.
Posisi buy dapat dibuka setelah harga naik dan berkonsolidasi di atas 27.80, dengan target di 30.00. Stop loss – 27.00.
Disclaimer: The content above represents only the views of the author or guest. It does not represent any views or positions of FOLLOWME and does not mean that FOLLOWME agrees with its statement or description, nor does it constitute any investment advice. For all actions taken by visitors based on information provided by the FOLLOWME community, the community does not assume any form of liability unless otherwise expressly promised in writing.
FOLLOWME Trading Community Website: https://www.followme.com


Hot
No comment on record. Start new comment.