Shares of Pfizer Inc., the largest American pharmaceutical company, are corrected at 27.00.
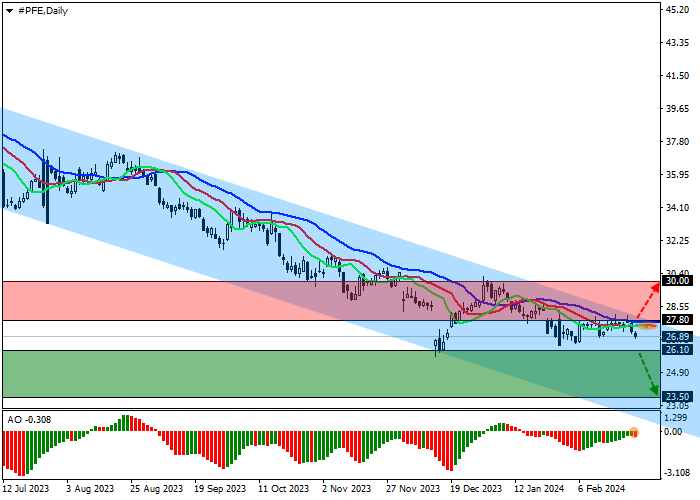
On the daily chart, the price is moving within the global downward channel with dynamic boundaries of 28.00–23.00, having unsuccessfully tested the resistance line yesterday.
On the four-hour chart, the quotes reversed and are ready to consolidate below the nearest low of 26.80, after which the next target will be the low of February 5 at 26.40 and then last year’s low of 26.00.
Technical indicators have issued a sell signal: fast EMA on the Alligator indicator are below the signal line, and the AO histogram is forming downward bars below the transition level.
Trading tips
Short positions may be opened after the price declines and consolidates below 26.10, with the target at 23.50. Stop loss – 27.00. Implementation period: 7 days or more.
Long positions may be opened after the price rises and consolidates above 27.80, with the target at 30.00. Stop loss – 27.00.
Disclaimer: The content above represents only the views of the author or guest. It does not represent any views or positions of FOLLOWME and does not mean that FOLLOWME agrees with its statement or description, nor does it constitute any investment advice. For all actions taken by visitors based on information provided by the FOLLOWME community, the community does not assume any form of liability unless otherwise expressly promised in writing.


Hot
No comment on record. Start new comment.