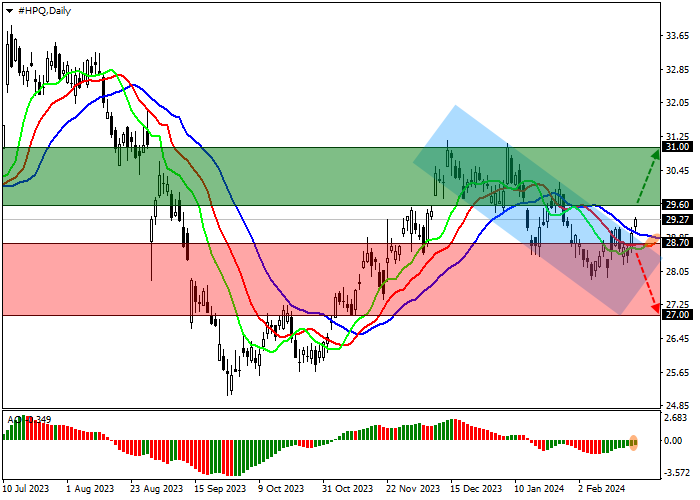
Shares of Hewlett-Packard Co., the American information technology giant, are trading at 29.20.
On the daily chart, the price is correcting, trying to consolidate above the resistance line of the local downward channel of 29.00–28.00.
On the four-hour chart, the downward range can work as a Flag continuation trend pattern. For its implementation, the quotes should consolidate above 29.00. If successful, the next resistance level will be the high of 30.00 and then the global target of 31.00.
Technical indicators are weakening the sell signal: fast EMAs on the Alligator indicator are approaching the signal line, and the AO histogram is forming corrective bars, approaching the transition level.
Trading tips
Long positions may be opened after the price rises and consolidates above 29.60 with the target at 31.00. Stop loss – 29.00. Implementation period: 7 days or more.
Short positions may be opened after the price declines and consolidates below 28.70 with the target at 27.00. Stop loss – 29.20.
Disclaimer: The content above represents only the views of the author or guest. It does not represent any views or positions of FOLLOWME and does not mean that FOLLOWME agrees with its statement or description, nor does it constitute any investment advice. For all actions taken by visitors based on information provided by the FOLLOWME community, the community does not assume any form of liability unless otherwise expressly promised in writing.


Hot
No comment on record. Start new comment.