Current trend
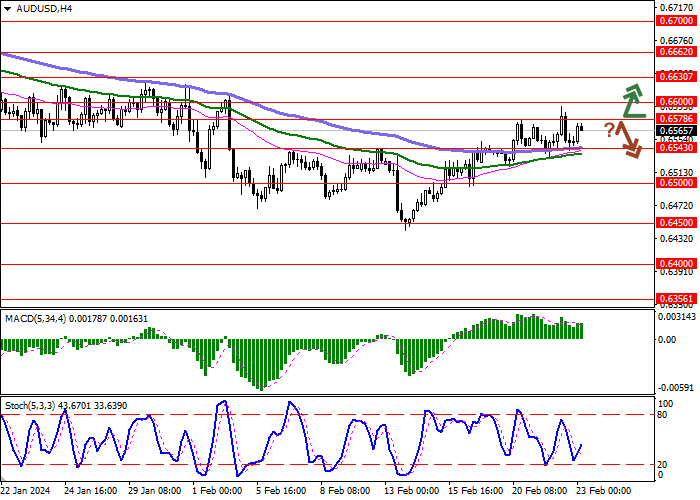
The AUD/USD pair is showing noticeable growth, showing the strongest dynamics this week and testing 0.6570 for a breakout. Macroeconomic statistics published the day before failed to provide long-term support for the US currency, while investors continue to lower expectations regarding the timing of the US Federal Reserve's possible transition to "dovish" rhetoric.
The US Services PMI in February slowed down from 52.5 points to 51.3 points, while analysts expected 52.0 points, and the Manufacturing PMI rose from 50.7 points to 51.5 points, with a forecast of 50.5 points. In addition, investors drew attention to the decrease in the number of Initial Jobless Claims for the week ended February 16 from 213.0 thousand to 201.0 thousand, with preliminary estimates at 218.0 thousand, and Continuing Jobless Claims for the week ended February 9 decreased from 1.889 million to 1.862 million with expectations at 1.885 million.
In turn, business activity statistics from Australia reflected an increase in the Commonwealth Bank Services PMI from 49.1 points to 52.8 points, the Manufacturing PMI dropped from 50.1 points to 47.7 points, and the Composite PMI strengthened from 49.0 points to 51.8 points. The resumption of positive dynamics in business activity increases the risks of accelerating inflation rates. Under these conditions, officials at the Reserve Bank of Australia (RBA) are unlikely to begin adjusting monetary policy before the fall.
Support and resistance
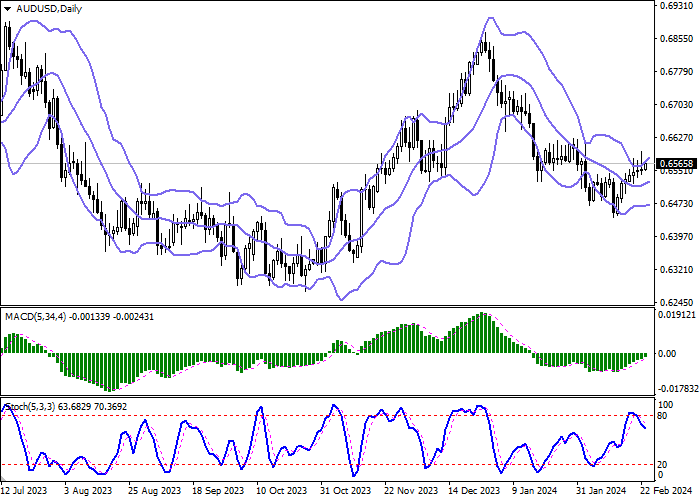
Bollinger Bands in D1 chart show moderate growth. The price range expands from above, freeing a path to new local highs for the "bulls". MACD grows, preserving a stable buy signal (located above the signal line). Stochastic, having retreated from its highs, reversed into a downward plane, reacting to "bearish" pressure during recent trading sessions. At the moment, one should wait for the signals from the indicator to be clarified.
Resistance levels: 0.6578, 0.6600, 0.6630, 0.6662.
Support levels: 0.6543, 0.6500, 0.6450, 0.6400.

Trading tips
Long positions can be opened after a breakout of 0.6578 with the target of 0.6630. Stop-loss — 0.6550. Implementation time: 1-2 days.
A rebound from 0.6578 as from resistance, followed by a breakdown of 0.6543 may become a signal for opening of new short positions with the target at 0.6450. Stop-loss — 0.6578.


Hot
No comment on record. Start new comment.