Current trend
During the Asian session, the American dollar is developing an uncertain “bearish” trend formed a week ago and is testing 103.85 in the USDX, while investors await the emergence of new drivers in the market.
Today, traders are focused on the US Fed meeting minutes at 21:00 (GMT 2): analysts expect increased “hawkish” rhetoric, leading to a later launch of the interest rate adjustment program. According to the Chicago Mercantile Exchange (CME Group) FedWatch Instrument, there is a 36.0% chance of a 25 basis point cut in May, and some analysts believe it will be pushed back to June. Also on Wednesday, there will be regulator representatives’ speeches, such as Federal Reserve Bank President Rafael Bostic and Federal Open Market Committee member Michelle Bowman. The officials traditionally speak more cautiously, predicting the possibility of two or three changes in borrowing costs by the end of the year by a total of 75 basis points.
Tomorrow, the asset dynamics may be influenced by January's US S&P Global PMI: according to preliminary estimates, service PMI will adjust from 52.5 points to 52.0 points, and manufacturing PMI – from 50.7 points to 50.5 points. In addition, initial jobless claims for the week of February 16 may increase from 212.0K to 218.0K.
Support and resistance
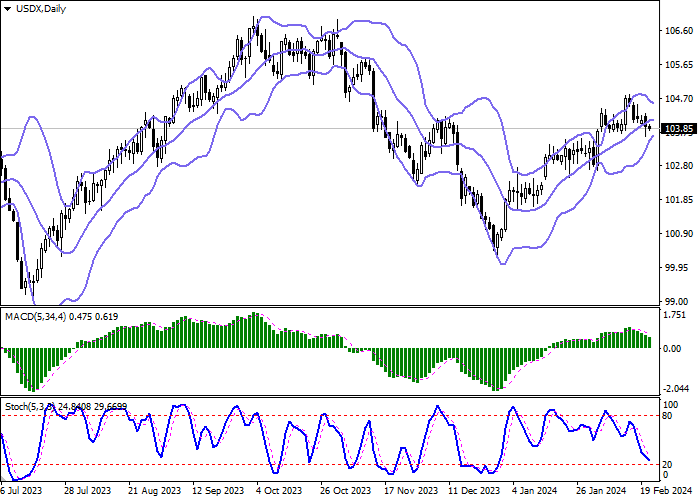
On the daily chart, Bollinger bands reverse horizontally: the price range is narrowing, reflecting the ambiguous nature of trading in the short term. The MACD indicator falls, maintaining a strong sell signal (the histogram is below the signal line). Stochastic shows similar dynamics, quickly approaching lows and indicating that the trading instrument may become oversold in the ultra-short term.
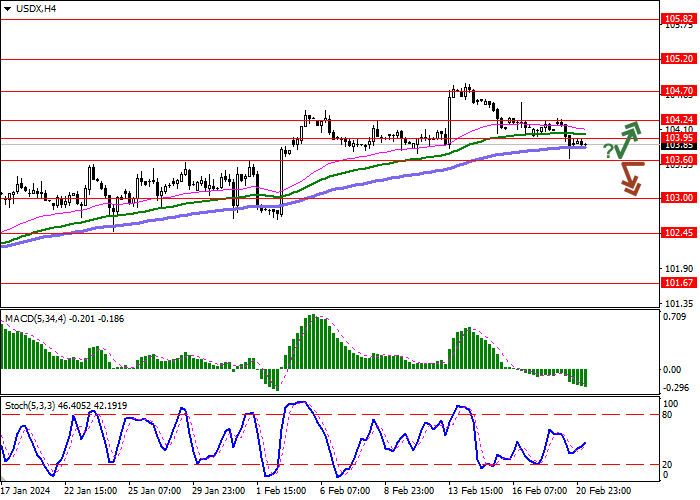
Resistance levels: 103.95, 104.24, 104.70, 105.20.
Support levels: 103.60, 103.00, 102.45, 101.67.

Trading tips
Short positions may be opened after a breakdown of 103.60 with the target at 103.00. Stop loss – 103.95. Implementation time: 1–2 days.
Long positions may be opened after a rebound from 103.60 and a breakout of 103.95 with the target at 104.70. Stop loss – 103.60.


Hot
No comment on record. Start new comment.