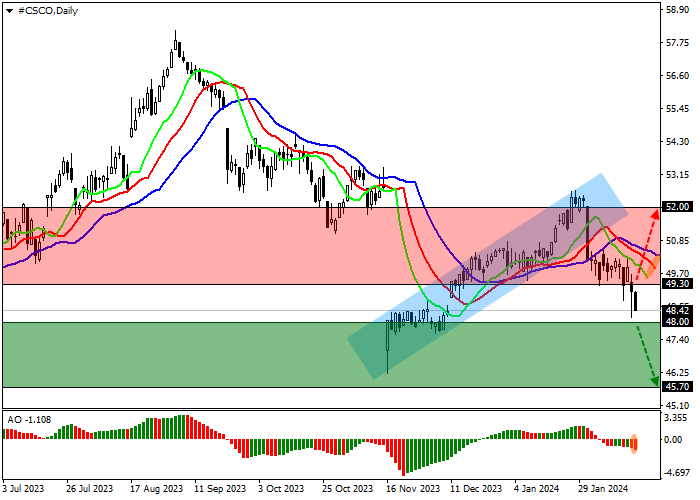
Saham Cisco Systems Inc., produsen dan pemasok peralatan jaringan Amerika untuk perusahaan besar dan telekomunikasi, diperdagangkan pada 48.00.
Pada grafik harian, harga terus menelusuri saluran naik baru-baru ini dengan batas dinamis 53.00–50.80.
Pada grafik empat jam terlihat potensi peningkatan penurunan instrumen trading tersebut masih ada, hal ini terkonfirmasi dengan beradanya harga di bawah level support lokal di 49.00. Target saat ini adalah titik terendah tahun lalu di 46.20, yang mungkin dicapai pada awal minggu depan.
Indikator teknis menahan sinyal sell: fast EMA pada indikator Alligator berada di bawah garis sinyal, dan histogram osilator AO membentuk bar korektif di zona sell.
Tips perdagangan
Posisi sell dapat dibuka setelah konsolidasi di bawah level support 48.00 dengan target di 45.70. Stop loss – 49.00. Periode implementasi: 7 hari atau lebih.
Posisi buy dapat dibuka setelah konsolidasi di atas level resistance 49.30 dengan target di 52.00. Stop loss – 48.50.
Disclaimer: The content above represents only the views of the author or guest. It does not represent any views or positions of FOLLOWME and does not mean that FOLLOWME agrees with its statement or description, nor does it constitute any investment advice. For all actions taken by visitors based on information provided by the FOLLOWME community, the community does not assume any form of liability unless otherwise expressly promised in writing.


Hot
No comment on record. Start new comment.