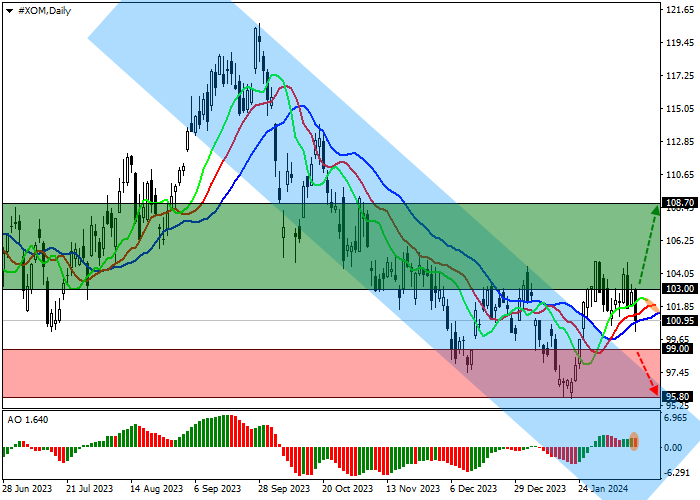
Saham ExxonMobil Corp., sebuah perusahaan minyak Amerika, diperdagangkan dalam tren koreksi lokal di 101.00.
Tren korektif global terbentuk pada grafik harian, dan harga berada di atas garis resistance koridor bawah 99.00–103.00.
Pada grafik empat jam, harga sedang menguji garis resistance yang dilewati di 101.00, setelah itu akan transit ke koreksi ke atas dengan target global di 109.00. Jika penurunan terus berlanjut, harga mungkin mencapai titik terendah tahun ini di 96.00.
Indikator teknikal menahan sinyal beli: fast EMA pada indikator Alligator berada di atas garis sinyal, dan histogram AO membentuk bar korektif di atas level transisi.
Tips perdagangan
Posisi buy dapat dibuka setelah harga naik dan berkonsolidasi di atas 103.00 dengan target di 108.70. Stop loss berada di sekitar 101.00. Periode implementasi: 7 hari atau lebih.
Posisi short dapat dibuka setelah harga turun dan berkonsolidasi di bawah 99.00 dengan target di 95.80. Stop loss – 101.00.
Disclaimer: The content above represents only the views of the author or guest. It does not represent any views or positions of FOLLOWME and does not mean that FOLLOWME agrees with its statement or description, nor does it constitute any investment advice. For all actions taken by visitors based on information provided by the FOLLOWME community, the community does not assume any form of liability unless otherwise expressly promised in writing.


Hot
No comment on record. Start new comment.