Saham General Electric Co., sebuah perusahaan terdiversifikasi Amerika, terus meningkat secara global, ditradingkan pada 142.00.
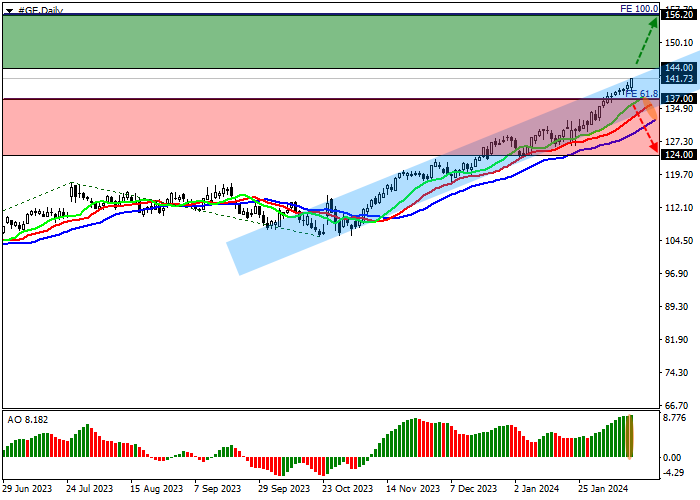
Pada grafik harian, harga bergerak dalam tren naik di sepanjang garis resistance channel lokal dengan batas dinamis 142.00–135.00.
Pada grafik empat jam, harga telah berkonsolidasi di atas 137.00 (tren awal Fibonacci extension 61.8%) dan menuju ke level resistance 156.00 (tren dasar Fibonacci extension 100.0%).
Indikator teknis menahan sinyal beli: fast EMA pada indikator Alligator berada di atas garis sinyal, memperluas jangkauan fluktuasi, dan histogram AO membentuk batang korektif di zona beli.
Tips perdagangan
Posisi buy dapat dibuka setelah harga naik dan berkonsolidasi di atas 144.00 dengan target di 156.20. Stop loss – 140.00. Periode implementasi: 7 hari atau lebih.
Posisi sell dapat dibuka setelah harga turun dan berkonsolidasi di bawah 137.00 dengan target di 124.00. Stop loss – 140.00.
Disclaimer: The content above represents only the views of the author or guest. It does not represent any views or positions of FOLLOWME and does not mean that FOLLOWME agrees with its statement or description, nor does it constitute any investment advice. For all actions taken by visitors based on information provided by the FOLLOWME community, the community does not assume any form of liability unless otherwise expressly promised in writing.


Hot
No comment on record. Start new comment.