Saham Altria Group Inc., salah satu pemimpin di pasar produk tembakau global, diperdagangkan pada 40.00.
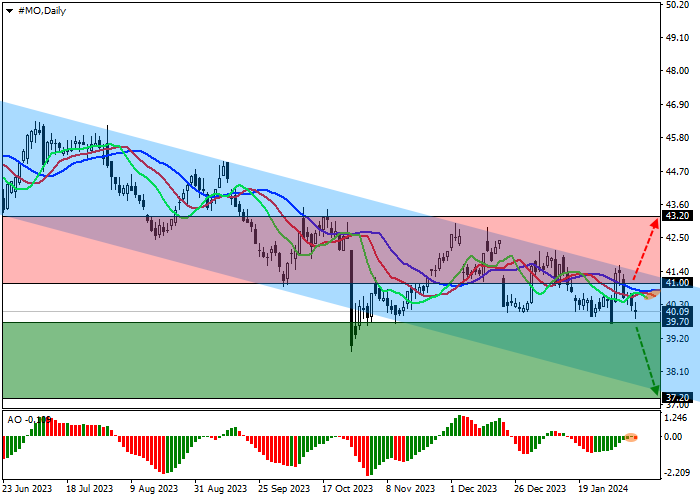
Pada grafik harian, harga bergerak dalam gelombang koreksi di dalam channel menurun global dengan batas dinamis 41.50–37.00.
Pada grafik empat jam, harga telah gagal menguji batas atas channel beberapa kali, dan karena tidak adanya volume perdagangan yang besar, harga berbalik dan mulai turun ke garis support di 37.50.
Indikator teknis mempertahankan sinyal sell yang tidak stabil: kisaran fluktuasi EMA pada indikator Alligator cukup sempit dan mengarah ke bawah, dan histogram AO membentuk bar korektif di zona sell.
Tips perdagangan
Posisi sell dapat dibuka setelah harga turun dan berkonsolidasi di bawah 39.70 dengan target di 37.20. Stop loss di atas 41.00. Periode implementasi: 7 hari atau lebih.
Posisi buy dapat dibuka setelah harga naik dan berkonsolidasi di atas 41.00 dengan target di 43.20. Stop loss di 40.00.
Disclaimer: The content above represents only the views of the author or guest. It does not represent any views or positions of FOLLOWME and does not mean that FOLLOWME agrees with its statement or description, nor does it constitute any investment advice. For all actions taken by visitors based on information provided by the FOLLOWME community, the community does not assume any form of liability unless otherwise expressly promised in writing.


Hot
No comment on record. Start new comment.