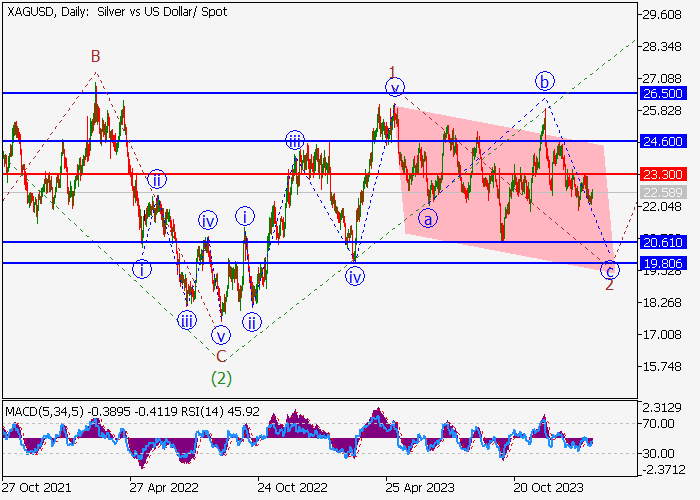
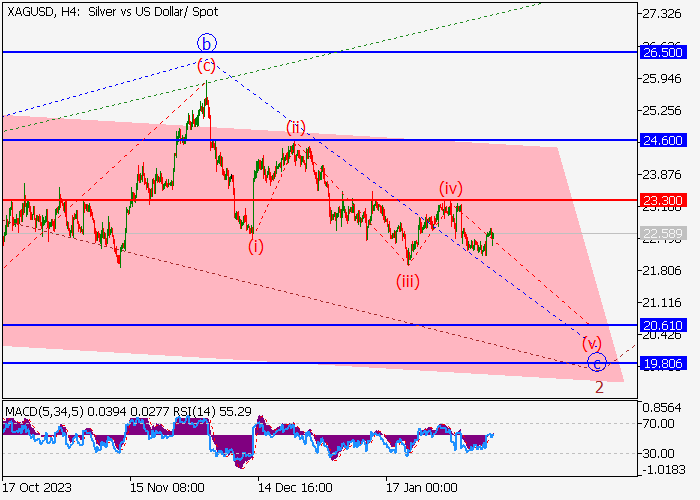
Pada grafik harian, wave ketiga dari level yang lebih tinggi (3) berkembang, di mana wave pertama 1 dari (3) berakhir, dan koreksi berlanjut sebagai wave kedua 2 dari (3). Sekarang, wave ke bawah c dari 2 terbentuk, di dalamnya wave (iii) dari c telah terbentuk, koreksi lokal telah berakhir saat wave (iv) dari c, dan wave (v) dari c terbentuk. Jika asumsi ini benar maka pair XAG/USD akan jatuh ke area 20.61–19.80. Dalam skenario ini, level stop loss kritis adalah 23.30.
Skenario utama
Posisi sell akan menjadi relevan di bawah level 23.30 dengan target di 20.61–19.80. Periode implementasi: 7 hari atau lebih.
Skenario alternatif
Penembusan dan konsolidasi harga di atas level 23.30 akan membuat aset bertumbuh ke area 24.60–26.50.
Disclaimer: The content above represents only the views of the author or guest. It does not represent any views or positions of FOLLOWME and does not mean that FOLLOWME agrees with its statement or description, nor does it constitute any investment advice. For all actions taken by visitors based on information provided by the FOLLOWME community, the community does not assume any form of liability unless otherwise expressly promised in writing.


Hot
No comment on record. Start new comment.