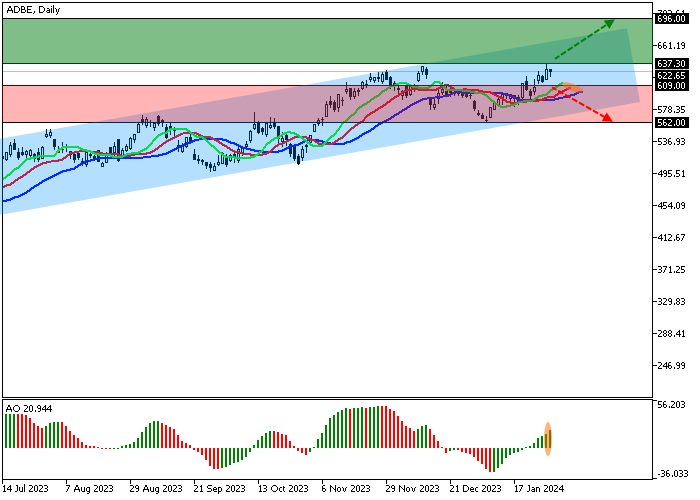
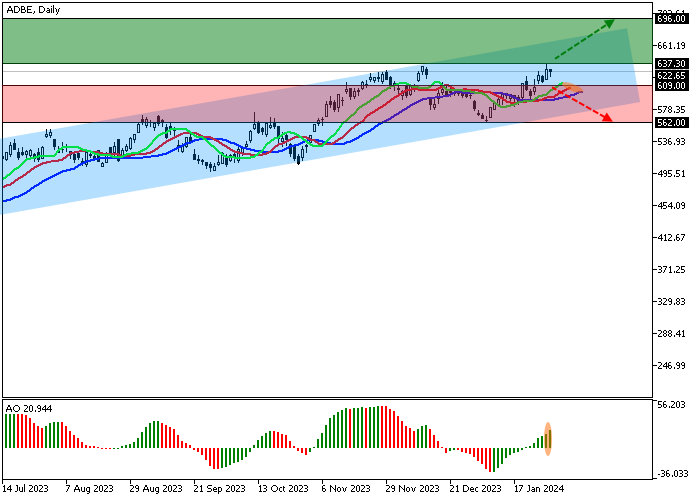
Saham Adobe Inc., pengembang perangkat lunak terkemuka Amerika, bergerak dalam tren korektif di 622.00.
Pada grafik harian, harga terkoreksi dalam koridor naik global dengan batas dinamis 676.00–560.00, membentuk gelombang pertumbuhan.
Pada grafik empat jam, harga berada di dekat harga tertinggi tahun lalu di 633.00, dan dalam gelombang saat ini, harga mungkin meninggalkan kisaran: setelah berkonsolidasi di atas garis resistance channel global di 660.00, harga mungkin mencapai 700.00.
Indikator teknis telah memberikan sinyal beli: kisaran fluktuasi EMA pada indikator Alligator meluas ke atas, dan histogram AO membentuk bar menaik di zona beli.
Tips perdagangan
Posisi buy dapat dibuka setelah harga naik dan berkonsolidasi di atas 637.30 dengan target di 696.00. Stop loss – 625.00. Periode implementasi: 7 hari atau lebih.
Posisi sell dapat dibuka setelah harga turun dan berkonsolidasi di bawah 609.00 dengan target di 562.00. Stop loss – 625.00.
Disclaimer: The content above represents only the views of the author or guest. It does not represent any views or positions of FOLLOWME and does not mean that FOLLOWME agrees with its statement or description, nor does it constitute any investment advice. For all actions taken by visitors based on information provided by the FOLLOWME community, the community does not assume any form of liability unless otherwise expressly promised in writing.


Hot
No comment on record. Start new comment.